This isn’t a personal blog, but today, my family had to say goodbye to our long-time pet, Kilroy, a retired racing greyhound. We had him for almost ten years, and his life here with us was firmly intertwined with my life in graduate school. So, writing about him here seems appropriate.
Two of those years were during a long bout of unemployment, which, as you may imagine, was a difficult time in our lives, especially mine. Having him around the house to keep me company and to keep me occupied was a lifesaver. Otherwise, especially in those early years, in which my novelty had yet to wear off, he was my “study buddy.” He would lie next to me as I spent hours reading, rolling over on occasion to solicit a “walkies” break.
On the bright side, my mother now has someone to dote on. My mother died six years ago. During our first visit to my parent’s condo after her passing, Kilroy paced around their place whining, in obvious distress, looking for where she had gone. When he realized she was gone, Kilroy went into my parent’s room, which he never did, laid by her side of the bed, and let out a mournful sigh.
It was the most wretched yet beautiful thing I’ve ever seen.
This morning, when we knew it was time, we sat with him and gave him ample hugs and a “pup cup” from Starbucks. I made him bacon and eggs for breakfast. He loved that.
How have the patterns of American military sacrifice changed throughout the 20th century, and how have said changes influenced our politics in the current year? This question has lingered in my mind for years. While it is a question tangentially related to my dissertation research, it has been a distraction that I cannot shake. I’ve written on this topic for Antiwar.com and on this blog. In both pieces, I argued a thesis that I still hold, that the sectional, economic, and racial disparities in military sacrifice have led to our current political strife.
But what about the past? How did we get here? Assuming that the latter is true, is it a new phenomenon? To answer it, I have, over the last few months, analyzed military fatality data available through the Defense Casualty Analysis System (DCAS) for the Global War on Terror (GWOT), the Vietnam War, as well as the Korean War. Yet, to really flesh this thing out, I needed records for the Second World War…and those are surprisingly difficult to obtain, at least in a transcribed form.
So I decided to do it myself and hand-jammed the county tabulations in the “WWII Army and Army Air Force Casualties” records currently available in pdf form from the National Archives. The records contain 3,123 county figures for all 48 states plus Washington, D.C., and total up to 307,757 U.S. Army and U.S. Army Air Forces killed and missing in action. I should note that the records also contain the names and geographic tabulations of those who hailed from America’s various territories (including Hawaii and Alaska).
These records do not contain figures for those who served within the Department of the Navy, which includes sailors, marines, and coastguardsmen. While the Navy records do list individuals and their street addresses, they do not offer county-level tabulations. I have, however, digitized the Navy Department’s state records and posted a CSV file with them and the Department of the Army figures. The said file is available on my GitHub.
Attempting a long-term analysis of county-level military fatalities without data from the Navy is, in the parlance of our times, problematic. The NARA records record that 66,370 sailors, marines, and coastguardmen were killed in the war. But there’s no way that I can, as a single person, transcribe every name and then geocode every address.
Spoiler alert: we’re still going to proceed, but before doing so, I’d like to pause and note that according to these datasets, 17.9% of American lives were lost during the war came from those who served within the Department of the Navy. They were not spread out evenly as 19 states endured slanted naval losses above the national average, including some highly populated states like California (graphic 1).
Graphic 1: This graphic depicts the military fatalities endured by the states in total losses and the relative number of deaths lost in naval service during World War II. Each dot represents a state that is colorized by region and sized by the number of total wartime fatalities (both Army and Navy). Each state is located on an x-axis that shows what percentage of that combined total was lost in naval service. The y-axis depicts the per-100k loss.
Even with incomplete records, that is, only those county-level statistics from the Department of the Army, I think we can still proceed with our inquiry. To make sense of the fatality records, I analyzed them against demographic data from the U.S. Census and the “1915-1941 Vital Statistics: Natality & Mortality Data [States & Counties]” made available through the National Historical Geographic Information System.1
Generating per capita statistics for the Department of the Army losses during the Second World War yields the following results (see interactive table below).
The table lists the county, state, and number of Army fatalities per 100k losses and the county’s percentage difference from the national per 100k (233.455). If you sort the records by the number of losses, unsurprisingly, the most populous county in 1940, Cook County, which contains Chicago, is at the top of the list. But, what is different from subsequent wars (to varying degrees, as we shall see) is that these highly populated counties all meet, exceed, or at the least come close to the national per 100k.
County
State
Number
Population in 1940
Fatalities Per 100k
Difference from National Per 100k
Autauga
Alabama
32
20977
152.5
65.3%
Baldwin
Alabama
44
32324
136.1
58.3%
Barbour
Alabama
36
32722
110.0
47.1%
Bibb
Alabama
39
20155
193.5
82.9%
Blount
Alabama
44
29490
149.2
63.9%
Bullock
Alabama
20
19810
101.0
43.2%
Butler
Alabama
58
32447
178.8
76.6%
Calhoun
Alabama
169
63319
266.9
114.3%
Chambers
Alabama
58
42146
137.6
58.9%
Cherokee
Alabama
29
19928
145.5
62.3%
Chilton
Alabama
49
27955
175.3
75.1%
Choctaw
Alabama
31
20195
153.5
65.8%
Clarke
Alabama
38
27636
137.5
58.9%
Clay
Alabama
27
16907
159.7
68.4%
Cleburne
Alabama
22
13629
161.4
69.1%
Coffee
Alabama
52
31987
162.6
69.6%
Colbert
Alabama
74
34093
217.1
93.0%
Conecuh
Alabama
27
25489
105.9
45.4%
Coosa
Alabama
30
13460
222.9
95.5%
Covington
Alabama
88
42417
207.5
88.9%
Crenshaw
Alabama
36
23631
152.3
65.3%
Cullman
Alabama
116
47343
245.0
105.0%
Dale
Alabama
35
22685
154.3
66.1%
Dallas
Alabama
71
55245
128.5
55.1%
De Kalb
Alabama
103
43075
239.1
102.4%
Elmore
Alabama
69
34546
199.7
85.6%
Escambia
Alabama
60
30671
195.6
83.8%
Etowah
Alabama
143
72580
197.0
84.4%
Fayette
Alabama
52
21651
240.2
102.9%
Franklin
Alabama
69
27552
250.4
107.3%
Geneva
Alabama
55
29172
188.5
80.8%
Greene
Alabama
10
19185
52.1
22.3%
Hale
Alabama
26
25533
101.8
43.6%
Henry
Alabama
23
21912
105.0
45.0%
Houston
Alabama
73
45665
159.9
68.5%
Jackson
Alabama
106
41802
253.6
108.6%
Jefferson
Alabama
874
459930
190.0
81.4%
Lamar
Alabama
39
19708
197.9
84.8%
Lauderdale
Alabama
90
46230
194.7
83.4%
Lawrence
Alabama
43
27880
154.2
66.1%
Lee
Alabama
62
36455
170.1
72.9%
Limestone
Alabama
59
35642
165.5
70.9%
Lowndes
Alabama
15
22661
66.2
28.4%
Macon
Alabama
28
27654
101.3
43.4%
Madison
Alabama
132
66317
199.0
85.3%
Marengo
Alabama
29
35736
81.2
34.8%
Marion
Alabama
74
28776
257.2
110.2%
Marshall
Alabama
102
42395
240.6
103.1%
Mobile
Alabama
249
141974
175.4
75.1%
Monroe
Alabama
24
29465
81.5
34.9%
Montgomery
Alabama
209
114420
182.7
78.2%
Morgan
Alabama
110
48148
228.5
97.9%
Perry
Alabama
21
26610
78.9
33.8%
Pickens
Alabama
40
27671
144.6
61.9%
Pike
Alabama
36
32493
110.8
47.5%
Randolph
Alabama
54
25516
211.6
90.7%
Russell
Alabama
51
35775
142.6
61.1%
Shelby
Alabama
41
28962
141.6
60.6%
St Clair
Alabama
63
27336
230.5
98.7%
Sumter
Alabama
21
27321
76.9
32.9%
Talladega
Alabama
132
51832
254.7
109.1%
Tallapoosa
Alabama
59
35270
167.3
71.7%
Tuscaloosa
Alabama
149
76036
196.0
83.9%
Walker
Alabama
150
64201
233.6
100.1%
Washington
Alabama
31
16188
191.5
82.0%
Wilcox
Alabama
34
26279
129.4
55.4%
Winston
Alabama
42
18746
224.0
96.0%
Arkansas
Arkansas
52
24437
212.8
91.1%
Ashley
Arkansas
52
26785
194.1
83.2%
Baxter
Arkansas
30
10281
291.8
125.0%
Benton
Arkansas
99
36148
273.9
117.3%
Boone
Arkansas
47
15860
296.3
126.9%
Bradley
Arkansas
39
18097
215.5
92.3%
Calhoun
Arkansas
29
9636
301.0
128.9%
Carroll
Arkansas
36
14737
244.3
104.6%
Chicot
Arkansas
32
27452
116.6
49.9%
Clark
Arkansas
49
24402
200.8
86.0%
Clay
Arkansas
65
28386
229.0
98.1%
Cleburne
Arkansas
26
13134
198.0
84.8%
Cleveland
Arkansas
22
12570
175.0
75.0%
Columbia
Arkansas
48
29822
161.0
68.9%
Conway
Arkansas
32
21536
148.6
63.6%
Craighead
Arkansas
100
47200
211.9
90.8%
Crawford
Arkansas
62
23920
259.2
111.0%
Crittenden
Arkansas
25
42473
58.9
25.2%
Cross
Arkansas
57
26046
218.8
93.7%
Dallas
Arkansas
22
14471
152.0
65.1%
Desha
Arkansas
46
27160
169.4
72.5%
Drew
Arkansas
30
19831
151.3
64.8%
Faulkner
Arkansas
62
25880
239.6
102.6%
Franklin
Arkansas
36
15683
229.5
98.3%
Fulton
Arkansas
27
10253
263.3
112.8%
Garland
Arkansas
95
41664
228.0
97.7%
Grant
Arkansas
24
10477
229.1
98.1%
Greene
Arkansas
50
30204
165.5
70.9%
Hempstead
Arkansas
52
32770
158.7
68.0%
Hot Spring
Arkansas
55
18916
290.8
124.5%
Howard
Arkansas
35
16621
210.6
90.2%
Independence
Arkansas
62
25643
241.8
103.6%
Izard
Arkansas
34
12834
264.9
113.5%
Jackson
Arkansas
50
26427
189.2
81.0%
Jefferson
Arkansas
86
65101
132.1
56.6%
Johnson
Arkansas
36
18795
191.5
82.0%
Lafayette
Arkansas
19
16851
112.8
48.3%
Lawrence
Arkansas
47
22651
207.5
88.9%
Lee
Arkansas
24
26810
89.5
38.3%
Lincoln
Arkansas
28
19709
142.1
60.9%
Little River
Arkansas
31
15932
194.6
83.3%
Logan
Arkansas
60
25967
231.1
99.0%
Lonoke
Arkansas
55
29802
184.6
79.1%
Madison
Arkansas
29
14531
199.6
85.5%
Marion
Arkansas
17
9464
179.6
76.9%
Miller
Arkansas
55
31874
172.6
73.9%
Mississippi
Arkansas
115
80217
143.4
61.4%
Monroe
Arkansas
33
21133
156.2
66.9%
Montgomery
Arkansas
22
8876
247.9
106.2%
Nevada
Arkansas
43
19869
216.4
92.7%
Newton
Arkansas
23
10881
211.4
90.5%
Ouachita
Arkansas
52
31151
166.9
71.5%
Perry
Arkansas
17
8392
202.6
86.8%
Phillips
Arkansas
53
45970
115.3
49.4%
Pike
Arkansas
29
11786
246.1
105.4%
Poinsett
Arkansas
85
37670
225.6
96.7%
Polk
Arkansas
47
15832
296.9
127.2%
Pope
Arkansas
35
25682
136.3
58.4%
Prairie
Arkansas
34
15304
222.2
95.2%
Pulaski
Arkansas
327
156085
209.5
89.7%
Randolph
Arkansas
30
18319
163.8
70.1%
Saline
Arkansas
38
19163
198.3
84.9%
Scott
Arkansas
26
13300
195.5
83.7%
Searcy
Arkansas
24
11942
201.0
86.1%
Sebastian
Arkansas
154
62809
245.2
105.0%
Sevier
Arkansas
34
15248
223.0
95.5%
Sharp
Arkansas
27
11497
234.8
100.6%
St Francis
Arkansas
41
36043
113.8
48.7%
St.one
Arkansas
14
8603
162.7
69.7%
Union
Arkansas
94
50461
186.3
79.8%
Van Buren
Arkansas
36
12518
287.6
123.2%
Washington
Arkansas
105
41114
255.4
109.4%
White
Arkansas
76
37176
204.4
87.6%
Woodruff
Arkansas
32
22133
144.6
61.9%
Yell
Arkansas
48
20970
228.9
98.0%
Apache
Arizona
51
24095
211.7
90.7%
Cochise
Arizona
111
34627
320.6
137.3%
Coconino
Arizona
49
18770
261.1
111.8%
Gila
Arizona
87
23867
364.5
156.1%
Graham
Arizona
49
12113
404.5
173.3%
Greenlee
Arizona
31
8698
356.4
152.7%
Maricopa
Arizona
514
186193
276.1
118.2%
Mohave
Arizona
22
8591
256.1
109.7%
Navajo
Arizona
64
25309
252.9
108.3%
Pima
Arizona
239
72838
328.1
140.6%
Pinal
Arizona
115
28841
398.7
170.8%
Santa Cruz
Arizona
43
9482
453.5
194.3%
Yavapai
Arizona
80
26511
301.8
129.3%
Yuma
Arizona
80
19326
414.0
177.3%
Alameda
California
1266
513011
246.8
105.7%
Alpine
California
1
323
309.6
132.6%
Amador
California
22
8973
245.2
105.0%
Butte
California
107
42840
249.8
107.0%
Calaveras
California
21
8221
255.4
109.4%
Colusa
California
25
9788
255.4
109.4%
Contra Costa
California
320
100450
318.6
136.5%
Del Norte
California
7
4745
147.5
63.2%
El Dorado
California
27
13229
204.1
87.4%
Fresno
California
511
178565
286.2
122.6%
Glenn
California
32
12195
262.4
112.4%
Humboldt
California
114
45812
248.8
106.6%
Imperial
California
107
59740
179.1
76.7%
Inyo
California
28
7625
367.2
157.3%
Kern
California
340
135124
251.6
107.8%
Kings
California
104
35168
295.7
126.7%
Lake
California
26
8069
322.2
138.0%
Lassen
California
49
14479
338.4
145.0%
Los Angeles
California
6674
2785643
239.6
102.6%
Madera
California
79
23314
338.9
145.1%
Marin
California
103
52907
194.7
83.4%
Mariposa
California
6
5605
107.0
45.9%
Mendocino
California
54
27864
193.8
83.0%
Merced
California
103
46988
219.2
93.9%
Modoc
California
23
8713
264.0
113.1%
Mono
California
11
2299
478.5
205.0%
Monterey
California
240
73032
328.6
140.8%
Napa
California
57
28503
200.0
85.7%
Nevada
California
42
19283
217.8
93.3%
Orange
California
334
130760
255.4
109.4%
Placer
California
75
28108
266.8
114.3%
Plumas
California
49
11548
424.3
181.8%
Riverside
California
314
105524
297.6
127.5%
Sacramento
California
441
170333
258.9
110.9%
San Benito
California
36
11392
316.0
135.4%
San Bernardino
California
441
161108
273.7
117.3%
San Diego
California
775
289348
267.8
114.7%
San Francisco
California
1365
634536
215.1
92.1%
San Joaquin
California
283
134207
210.9
90.3%
San Luis Obispo
California
89
33246
267.7
114.7%
San Mateo
California
220
111782
196.8
84.3%
Santa Barbara
California
153
70555
216.9
92.9%
Santa Clara
California
441
174949
252.1
108.0%
Santa Cruz
California
88
45057
195.3
83.7%
Shasta
California
69
28800
239.6
102.6%
Sierra
California
12
3025
396.7
169.9%
Siskiyou
California
72
28598
251.8
107.8%
Solano
California
150
49118
305.4
130.8%
Sonoma
California
165
69052
239.0
102.4%
St.anislaus
California
178
74866
237.8
101.8%
Sutter
California
61
18680
326.6
139.9%
Tehama
California
17
14316
118.7
50.9%
Trinity
California
9
3970
226.7
97.1%
Tulare
California
246
107152
229.6
98.3%
Tuolumne
California
26
10887
238.8
102.3%
Ventura
California
216
69685
310.0
132.8%
Yolo
California
72
27243
264.3
113.2%
Yuba
California
45
17034
264.2
113.2%
Adams
Colorado
42
22481
186.8
80.0%
Alamosa
Colorado
34
10484
324.3
138.9%
Arapahoe
Colorado
64
32150
199.1
85.3%
Archuleta
Colorado
17
3806
446.7
191.3%
Baca
Colorado
14
6207
225.6
96.6%
Bent
Colorado
25
9653
259.0
110.9%
Boulder
Colorado
88
37438
235.1
100.7%
Chaffee
Colorado
18
8109
222.0
95.1%
Cheyenne
Colorado
9
2964
303.6
130.1%
Clear Creek
Colorado
9
3784
237.8
101.9%
Conejos
Colorado
31
11648
266.1
114.0%
Costilla
Colorado
11
7533
146.0
62.5%
Crowley
Colorado
22
5398
407.6
174.6%
Custer
Colorado
7
2270
308.4
132.1%
Delta
Colorado
44
16470
267.2
114.4%
Denver
Colorado
786
322412
243.8
104.4%
Dolores
Colorado
1
1958
51.1
21.9%
Douglas
Colorado
7
3496
200.2
85.8%
Eagle
Colorado
7
5361
130.6
55.9%
Elbert
Colorado
3
5460
54.9
23.5%
El Paso
Colorado
141
54025
261.0
111.8%
Fremont
Colorado
53
19742
268.5
115.0%
Garfield
Colorado
29
10560
274.6
117.6%
Gilpin
Colorado
1
1625
61.5
26.4%
Grand
Colorado
14
3587
390.3
167.2%
Gunnison
Colorado
16
6192
258.4
110.7%
Hinsdale
Colorado
2
349
573.1
245.5%
Huerfano
Colorado
42
16088
261.1
111.8%
Jackson
Colorado
6
1798
333.7
142.9%
Jefferson
Colorado
57
30725
185.5
79.5%
Kiowa
Colorado
15
2793
537.1
230.0%
Kit Carson
Colorado
16
7512
213.0
91.2%
Lake
Colorado
19
6883
276.0
118.2%
La Plata
Colorado
39
15494
251.7
107.8%
Larimer
Colorado
77
35539
216.7
92.8%
Las Animas
Colorado
81
32369
250.2
107.2%
Lincoln
Colorado
17
5882
289.0
123.8%
Logan
Colorado
39
18370
212.3
90.9%
Mesa
Colorado
73
33791
216.0
92.5%
Mineral
Colorado
1
975
102.6
43.9%
Moffat
Colorado
15
5086
294.9
126.3%
Montezuma
Colorado
20
10463
191.1
81.9%
Montrose
Colorado
45
15418
291.9
125.0%
Morgan
Colorado
50
17214
290.5
124.4%
Otero
Colorado
39
23571
165.5
70.9%
Ouray
Colorado
4
2089
191.5
82.0%
Park
Colorado
7
3272
213.9
91.6%
Phillips
Colorado
18
4948
363.8
155.8%
Pitkin
Colorado
2
1836
108.9
46.7%
Prowers
Colorado
44
12304
357.6
153.2%
Pueblo
Colorado
151
68870
219.3
93.9%
Rio Blanco
Colorado
14
2943
475.7
203.8%
Rio Grande
Colorado
30
12404
241.9
103.6%
Routt
Colorado
25
10525
237.5
101.7%
Saguache
Colorado
14
6173
226.8
97.1%
San Juan
Colorado
3
1439
208.5
89.3%
San Miguel
Colorado
8
3664
218.3
93.5%
Sedgwick
Colorado
9
5294
170.0
72.8%
Summit
Colorado
2
1754
114.0
48.8%
Teller
Colorado
15
6463
232.1
99.4%
Washington
Colorado
11
8336
132.0
56.5%
Weld
Colorado
136
63747
213.3
91.4%
Yuma
Colorado
30
12102
247.9
106.2%
Fairfield
Connecticut
1097
418384
262.2
112.3%
Hartford
Connecticut
1238
450189
275.0
117.8%
Litchfield
Connecticut
232
87041
266.5
114.2%
Middlesex
Connecticut
136
55999
242.9
104.0%
New Haven
Connecticut
1143
484316
236.0
101.1%
New London
Connecticut
250
125224
199.6
85.5%
Tolland
Connecticut
66
31866
207.1
88.7%
Windham
Connecticut
147
56223
261.5
112.0%
District Of Columbia
District of Columbia
3029
663091
456.8
195.7%
Kent
Delaware
59
34441
171.3
73.4%
New Castle
Delaware
392
179562
218.3
93.5%
Sussex
Delaware
91
52502
173.3
74.2%
Alachua
Florida
59
38607
152.8
65.5%
Baker
Florida
18
6510
276.5
118.4%
Bay
Florida
56
20686
270.7
116.0%
Bradford
Florida
17
8717
195.0
83.5%
Brevard
Florida
26
16142
161.1
69.0%
Broward
Florida
50
39794
125.6
53.8%
Calhoun
Florida
24
8218
292.0
125.1%
Charlotte
Florida
8
3663
218.4
93.6%
Citrus
Florida
16
5846
273.7
117.2%
Clay
Florida
13
6468
201.0
86.1%
Collier
Florida
8
5102
156.8
67.2%
Columbia
Florida
27
16859
160.2
68.6%
De Soto
Florida
13
7792
166.8
71.5%
Dixie
Florida
10
7018
142.5
61.0%
Duval
Florida
392
210143
186.5
79.9%
Escambia
Florida
124
74667
166.1
71.1%
Flagler
Florida
5
3008
166.2
71.2%
Franklin
Florida
11
5991
183.6
78.6%
Gadsden
Florida
43
31450
136.7
58.6%
Gilchrist
Florida
9
4250
211.8
90.7%
Glades
Florida
6
2745
218.6
93.6%
Gulf
Florida
17
6951
244.6
104.8%
Hamilton
Florida
13
9778
133.0
56.9%
Hardee
Florida
25
10158
246.1
105.4%
Hendry
Florida
16
5237
305.5
130.9%
Hernando
Florida
15
5641
265.9
113.9%
Highlands
Florida
28
9246
302.8
129.7%
Hillsborough
Florida
363
180148
201.5
86.3%
Holmes
Florida
35
15447
226.6
97.1%
Indian River
Florida
16
8957
178.6
76.5%
Jackson
Florida
54
34428
156.8
67.2%
Jefferson
Florida
9
12032
74.8
32.0%
Lafayette
Florida
6
4405
136.2
58.3%
Lake
Florida
53
27255
194.5
83.3%
Lee
Florida
43
17488
245.9
105.3%
Leon
Florida
56
31646
177.0
75.8%
Levy
Florida
23
12550
183.3
78.5%
Liberty
Florida
10
3752
266.5
114.2%
Madison
Florida
19
16190
117.4
50.3%
Manatee
Florida
46
26098
176.3
75.5%
Marion
Florida
44
31243
140.8
60.3%
Martin
Florida
7
6295
111.2
47.6%
Dade
Florida
503
267739
187.9
80.5%
Monroe
Florida
30
14078
213.1
91.3%
Nassau
Florida
15
10826
138.6
59.3%
Okaloosa
Florida
34
12900
263.6
112.9%
Okeechobee
Florida
7
3000
233.3
99.9%
Orange
Florida
173
70074
246.9
105.8%
Osceola
Florida
14
10119
138.4
59.3%
Palm Beach
Florida
122
79989
152.5
65.3%
Pasco
Florida
29
13981
207.4
88.8%
Pinellas
Florida
138
91852
150.2
64.4%
Polk
Florida
200
86665
230.8
98.9%
Putnam
Florida
25
18698
133.7
57.3%
Santa Rosa
Florida
28
16085
174.1
74.6%
Sarasota
Florida
33
16106
204.9
87.8%
Seminole
Florida
37
22304
165.9
71.1%
St Johns
Florida
41
20012
204.9
87.8%
St Lucie
Florida
20
11871
168.5
72.2%
Sumter
Florida
19
11041
172.1
73.7%
Suwannee
Florida
29
17073
169.9
72.8%
Taylor
Florida
16
11565
138.3
59.3%
Union
Florida
9
7094
126.9
54.3%
Volusia
Florida
87
53710
162.0
69.4%
Wakulla
Florida
8
5463
146.4
62.7%
Walton
Florida
31
14246
217.6
93.2%
Washington
Florida
25
12302
203.2
87.0%
Appling
Georgia
33
14497
227.6
97.5%
Atkinson
Georgia
12
7093
169.2
72.5%
Bacon
Georgia
15
8096
185.3
79.4%
Baker
Georgia
5
7344
68.1
29.2%
Baldwin
Georgia
29
24190
119.9
51.4%
Banks
Georgia
11
8733
126.0
54.0%
Barrow
Georgia
40
13064
306.2
131.2%
Bartow
Georgia
47
25283
185.9
79.6%
Ben Hill
Georgia
22
14523
151.5
64.9%
Berrien
Georgia
18
15370
117.1
50.2%
Bibb
Georgia
160
83783
191.0
81.8%
Bleckley
Georgia
22
9655
227.9
97.6%
Brantley
Georgia
17
6871
247.4
106.0%
Brooks
Georgia
23
20497
112.2
48.1%
Bryan
Georgia
12
6288
190.8
81.7%
Bulloch
Georgia
33
26010
126.9
54.3%
Burke
Georgia
24
26520
90.5
38.8%
Butts
Georgia
19
9182
206.9
88.6%
Calhoun
Georgia
16
10438
153.3
65.7%
Camden
Georgia
7
5910
118.4
50.7%
Candler
Georgia
11
9103
120.8
51.8%
Carroll
Georgia
78
34156
228.4
97.8%
Catoosa
Georgia
19
12199
155.8
66.7%
Charlton
Georgia
17
5256
323.4
138.5%
Chatham
Georgia
223
117970
189.0
81.0%
Chattahoochee
Georgia
12
15138
79.3
34.0%
Chattooga
Georgia
43
18532
232.0
99.4%
Cherokee
Georgia
42
20126
208.7
89.4%
Clarke
Georgia
59
28398
207.8
89.0%
Clay
Georgia
9
7064
127.4
54.6%
Clayton
Georgia
25
11655
214.5
91.9%
Clinch
Georgia
7
6437
108.7
46.6%
Cobb
Georgia
70
38272
182.9
78.3%
Coffee
Georgia
42
21541
195.0
83.5%
Colquitt
Georgia
58
33012
175.7
75.3%
Columbia
Georgia
12
9433
127.2
54.5%
Cook
Georgia
30
11919
251.7
107.8%
Coweta
Georgia
42
26972
155.7
66.7%
Crawford
Georgia
12
7128
168.4
72.1%
Crisp
Georgia
24
17540
136.8
58.6%
Dade
Georgia
13
5894
220.6
94.5%
Dawson
Georgia
9
4479
200.9
86.1%
Decatur
Georgia
49
22234
220.4
94.4%
Dekalb
Georgia
120
86942
138.0
59.1%
Dodge
Georgia
33
21022
157.0
67.2%
Dooly
Georgia
25
16886
148.1
63.4%
Dougherty
Georgia
55
28565
192.5
82.5%
Douglas
Georgia
15
10053
149.2
63.9%
Early
Georgia
14
18679
75.0
32.1%
Echols
Georgia
4
2964
135.0
57.8%
Effingham
Georgia
13
9646
134.8
57.7%
Elbert
Georgia
31
19618
158.0
67.7%
Emanuel
Georgia
32
23517
136.1
58.3%
Evans
Georgia
10
7401
135.1
57.9%
Fannin
Georgia
30
14752
203.4
87.1%
Fayette
Georgia
14
8170
171.4
73.4%
Floyd
Georgia
115
56141
204.8
87.7%
Forsyth
Georgia
13
11322
114.8
49.2%
Franklin
Georgia
24
15612
153.7
65.8%
Fulton
Georgia
883
392886
224.7
96.3%
Gilmer
Georgia
26
9001
288.9
123.7%
Glascock
Georgia
10
4547
219.9
94.2%
Glynn
Georgia
60
21920
273.7
117.2%
Gordon
Georgia
43
18445
233.1
99.9%
Grady
Georgia
33
19654
167.9
71.9%
Greene
Georgia
27
13709
197.0
84.4%
Gwinnett
Georgia
57
29087
196.0
83.9%
Habersham
Georgia
30
14771
203.1
87.0%
Hall
Georgia
99
34822
284.3
121.8%
Hancock
Georgia
18
12764
141.0
60.4%
Haralson
Georgia
28
14377
194.8
83.4%
Harris
Georgia
16
11428
140.0
60.0%
Hart
Georgia
26
15512
167.6
71.8%
Heard
Georgia
12
8610
139.4
59.7%
Henry
Georgia
20
15119
132.3
56.7%
Houston
Georgia
12
11303
106.2
45.5%
Irwin
Georgia
10
12936
77.3
33.1%
Jackson
Georgia
48
20089
238.9
102.3%
Jasper
Georgia
19
8772
216.6
92.8%
Jeff Davis
Georgia
13
8841
147.0
63.0%
Jefferson
Georgia
32
20040
159.7
68.4%
Jenkins
Georgia
16
11843
135.1
57.9%
Johnson
Georgia
18
12953
139.0
59.5%
Jones
Georgia
10
8331
120.0
51.4%
Lamar
Georgia
23
10091
227.9
97.6%
Lanier
Georgia
13
5632
230.8
98.9%
Laurens
Georgia
76
33606
226.2
96.9%
Lee
Georgia
8
7837
102.1
43.7%
Liberty
Georgia
12
8595
139.6
59.8%
Lincoln
Georgia
7
7042
99.4
42.6%
Long
Georgia
6
4086
146.8
62.9%
Lowndes
Georgia
50
31860
156.9
67.2%
Lumpkin
Georgia
14
6223
225.0
96.4%
Macon
Georgia
44
15947
275.9
118.2%
Madison
Georgia
32
13431
238.3
102.1%
Marion
Georgia
5
6954
71.9
30.8%
Mcduffie
Georgia
31
10878
285.0
122.1%
Meriwether
Georgia
36
22055
163.2
69.9%
Miller
Georgia
12
9998
120.0
51.4%
Mitchell
Georgia
27
23261
116.1
49.7%
Monroe
Georgia
11
10749
102.3
43.8%
Montgomery
Georgia
7
9668
72.4
31.0%
Morgan
Georgia
20
12713
157.3
67.4%
Murray
Georgia
23
11137
206.5
88.5%
Muscogee
Georgia
207
75494
274.2
117.5%
Newton
Georgia
36
18576
193.8
83.0%
Oconee
Georgia
16
7576
211.2
90.5%
Oglethorpe
Georgia
6
12430
48.3
20.7%
Paulding
Georgia
21
12832
163.7
70.1%
Peach
Georgia
20
10378
192.7
82.5%
Pickens
Georgia
13
9136
142.3
61.0%
Pierce
Georgia
24
11800
203.4
87.1%
Pike
Georgia
18
10375
173.5
74.3%
Polk
Georgia
64
28467
224.8
96.3%
Pulaski
Georgia
12
9829
122.1
52.3%
Putnam
Georgia
12
8514
140.9
60.4%
Quitman
Georgia
8
3435
232.9
99.8%
Rabun
Georgia
20
7821
255.7
109.5%
Randolph
Georgia
12
16609
72.2
30.9%
Richmond
Georgia
138
81863
168.6
72.2%
Rockdale
Georgia
14
7724
181.3
77.6%
Schley
Georgia
8
5033
159.0
68.1%
Screven
Georgia
31
20353
152.3
65.2%
Seminole
Georgia
13
8492
153.1
65.6%
Spalding
Georgia
62
28427
218.1
93.4%
St.ephens
Georgia
38
12972
292.9
125.5%
St.ewart
Georgia
10
10603
94.3
40.4%
Sumter
Georgia
35
24502
142.8
61.2%
Talbot
Georgia
5
8141
61.4
26.3%
Taliaferro
Georgia
4
6278
63.7
27.3%
Tattnall
Georgia
26
16243
160.1
68.6%
Taylor
Georgia
17
10768
157.9
67.6%
Telfair
Georgia
26
15145
171.7
73.5%
Terrell
Georgia
24
16675
143.9
61.7%
Thomas
Georgia
49
31289
156.6
67.1%
Tift
Georgia
34
18599
182.8
78.3%
Toombs
Georgia
31
16952
182.9
78.3%
Towns
Georgia
13
4925
264.0
113.1%
Treutlen
Georgia
9
7632
117.9
50.5%
Troup
Georgia
84
43879
191.4
82.0%
Turner
Georgia
16
10846
147.5
63.2%
Twiggs
Georgia
5
9117
54.8
23.5%
Union
Georgia
14
7680
182.3
78.1%
Upson
Georgia
45
25064
179.5
76.9%
Walker
Georgia
83
31024
267.5
114.6%
Walton
Georgia
31
20777
149.2
63.9%
Ware
Georgia
58
27929
207.7
89.0%
Warren
Georgia
13
10236
127.0
54.4%
Washington
Georgia
34
24230
140.3
60.1%
Wayne
Georgia
21
13122
160.0
68.6%
Webster
Georgia
1
4726
21.2
9.1%
Wheeler
Georgia
17
8535
199.2
85.3%
White
Georgia
12
6417
187.0
80.1%
Whitfield
Georgia
56
26105
214.5
91.9%
Wilcox
Georgia
27
12755
211.7
90.7%
Wilkes
Georgia
9
15084
59.7
25.6%
Wilkinson
Georgia
12
11025
108.8
46.6%
Worth
Georgia
19
21374
88.9
38.1%
Adair
Iowa
34
13196
257.7
110.4%
Adams
Iowa
27
10156
265.9
113.9%
Allamakee
Iowa
30
17184
174.6
74.8%
Appanoose
Iowa
65
24245
268.1
114.8%
Audubon
Iowa
31
11790
262.9
112.6%
Benton
Iowa
54
22879
236.0
101.1%
Black Hawk
Iowa
201
79946
251.4
107.7%
Boone
Iowa
66
29782
221.6
94.9%
Bremer
Iowa
29
17932
161.7
69.3%
Buchanan
Iowa
33
20991
157.2
67.3%
Buena Vista
Iowa
35
19838
176.4
75.6%
Butler
Iowa
38
17986
211.3
90.5%
Calhoun
Iowa
43
17584
244.5
104.7%
Carroll
Iowa
50
22770
219.6
94.1%
Cass
Iowa
47
18647
252.1
108.0%
Cedar
Iowa
35
16884
207.3
88.8%
Cerro Gordo
Iowa
112
43845
255.4
109.4%
Cherokee
Iowa
37
19258
192.1
82.3%
Chickasaw
Iowa
30
15227
197.0
84.4%
Clarke
Iowa
20
10233
195.4
83.7%
Clay
Iowa
30
17762
168.9
72.3%
Clayton
Iowa
36
24334
147.9
63.4%
Clinton
Iowa
101
44722
225.8
96.7%
Crawford
Iowa
56
20538
272.7
116.8%
Dallas
Iowa
55
24649
223.1
95.6%
Davis
Iowa
27
11136
242.5
103.9%
Decatur
Iowa
47
14012
335.4
143.7%
Delaware
Iowa
35
18487
189.3
81.1%
Des Moines
Iowa
105
36804
285.3
122.2%
Dickinson
Iowa
23
12185
188.8
80.9%
Dubuque
Iowa
162
63768
254.0
108.8%
Emmet
Iowa
40
13406
298.4
127.8%
Fayette
Iowa
55
29151
188.7
80.8%
Floyd
Iowa
49
20169
242.9
104.1%
Franklin
Iowa
24
16379
146.5
62.8%
Fremont
Iowa
46
14645
314.1
134.5%
Greene
Iowa
46
16599
277.1
118.7%
Grundy
Iowa
34
13518
251.5
107.7%
Guthrie
Iowa
38
17210
220.8
94.6%
Hamilton
Iowa
46
19922
230.9
98.9%
Hancock
Iowa
26
15402
168.8
72.3%
Hardin
Iowa
32
22530
142.0
60.8%
Harrison
Iowa
45
22767
197.7
84.7%
Henry
Iowa
39
17994
216.7
92.8%
Howard
Iowa
29
13531
214.3
91.8%
Humboldt
Iowa
32
13459
237.8
101.8%
Ida
Iowa
23
11047
208.2
89.2%
Iowa
Iowa
33
17016
193.9
83.1%
Jackson
Iowa
27
19181
140.8
60.3%
Jasper
Iowa
64
31496
203.2
87.0%
Jefferson
Iowa
43
15762
272.8
116.9%
Johnson
Iowa
75
33191
226.0
96.8%
Jones
Iowa
33
19950
165.4
70.9%
Keokuk
Iowa
43
18406
233.6
100.1%
Kossuth
Iowa
69
26630
259.1
111.0%
Lee
Iowa
98
41074
238.6
102.2%
Linn
Iowa
213
89142
238.9
102.4%
Louisa
Iowa
25
11384
219.6
94.1%
Lucas
Iowa
21
14571
144.1
61.7%
Lyon
Iowa
27
15374
175.6
75.2%
Madison
Iowa
23
14525
158.3
67.8%
Mahaska
Iowa
54
26485
203.9
87.3%
Marion
Iowa
35
27019
129.5
55.5%
Marshall
Iowa
52
35406
146.9
62.9%
Mills
Iowa
31
15064
205.8
88.1%
Mitchell
Iowa
32
14121
226.6
97.1%
Monona
Iowa
41
18238
224.8
96.3%
Monroe
Iowa
32
14553
219.9
94.2%
Montgomery
Iowa
46
15697
293.0
125.5%
Muscatine
Iowa
64
31296
204.5
87.6%
O'brien
Iowa
42
19293
217.7
93.2%
Osceola
Iowa
13
10607
122.6
52.5%
Page
Iowa
56
24887
225.0
96.4%
Palo Alto
Iowa
44
16170
272.1
116.6%
Plymouth
Iowa
54
23502
229.8
98.4%
Pocahontas
Iowa
33
16266
202.9
86.9%
Polk
Iowa
450
195835
229.8
98.4%
Pottawattamie
Iowa
152
66756
227.7
97.5%
Poweshiek
Iowa
41
18758
218.6
93.6%
Ringgold
Iowa
28
11137
251.4
107.7%
Sac
Iowa
28
17639
158.7
68.0%
Scott
Iowa
168
84748
198.2
84.9%
Shelby
Iowa
29
16720
173.4
74.3%
Sioux
Iowa
66
27209
242.6
103.9%
St.ory
Iowa
95
33434
284.1
121.7%
Tama
Iowa
39
22428
173.9
74.5%
Taylor
Iowa
29
14258
203.4
87.1%
Union
Iowa
33
16280
202.7
86.8%
Van Buren
Iowa
31
12053
257.2
110.2%
Wapello
Iowa
99
44280
223.6
95.8%
Warren
Iowa
47
17695
265.6
113.8%
Washington
Iowa
54
20055
269.3
115.3%
Wayne
Iowa
31
13308
232.9
99.8%
Webster
Iowa
97
41521
233.6
100.1%
Winnebago
Iowa
33
13972
236.2
101.2%
Winneshiek
Iowa
30
22263
134.8
57.7%
Woodbury
Iowa
234
103627
225.8
96.7%
Worth
Iowa
28
11449
244.6
104.8%
Wright
Iowa
39
20038
194.6
83.4%
Ada
Idaho
119
50401
236.1
101.1%
Adams
Idaho
12
3407
352.2
150.9%
Bannock
Idaho
89
34759
256.0
109.7%
Bear Lake
Idaho
21
7911
265.5
113.7%
Benewah
Idaho
20
7332
272.8
116.8%
Bingham
Idaho
49
21044
232.8
99.7%
Blaine
Idaho
8
5295
151.1
64.7%
Boise
Idaho
9
2333
385.8
165.2%
Bonner
Idaho
44
15667
280.8
120.3%
Bonneville
Idaho
69
25697
268.5
115.0%
Boundary
Idaho
17
5987
283.9
121.6%
Butte
Idaho
4
1877
213.1
91.3%
Camas
Idaho
6
1360
441.2
189.0%
Canyon
Idaho
110
40987
268.4
115.0%
Caribou
Idaho
9
2284
394.0
168.8%
Cassia
Idaho
36
14430
249.5
106.9%
Clark
Idaho
5
1005
497.5
213.1%
Clearwater
Idaho
27
8243
327.6
140.3%
Custer
Idaho
10
3549
281.8
120.7%
Elmore
Idaho
15
5518
271.8
116.4%
Franklin
Idaho
17
10229
166.2
71.2%
Fremont
Idaho
23
10304
223.2
95.6%
Gem
Idaho
26
9544
272.4
116.7%
Gooding
Idaho
24
9257
259.3
111.1%
Idaho
Idaho
24
12691
189.1
81.0%
Jefferson
Idaho
20
10762
185.8
79.6%
Jerome
Idaho
46
9900
464.6
199.0%
Kootenai
Idaho
66
22283
296.2
126.9%
Latah
Idaho
54
18804
287.2
123.0%
Lemhi
Idaho
20
6521
306.7
131.4%
Lewis
Idaho
18
4666
385.8
165.2%
Lincoln
Idaho
12
4230
283.7
121.5%
Madison
Idaho
24
9186
261.3
111.9%
Minidoka
Idaho
26
9870
263.4
112.8%
Nez Perce
Idaho
63
18873
333.8
143.0%
Oneida
Idaho
14
5417
258.4
110.7%
Owyhee
Idaho
10
5652
176.9
75.8%
Payette
Idaho
23
9511
241.8
103.6%
Power
Idaho
15
3965
378.3
162.0%
Shoshone
Idaho
50
21230
235.5
100.9%
Teton
Idaho
11
3601
305.5
130.8%
Twin Falls
Idaho
86
36403
236.2
101.2%
Valley
Idaho
14
4035
347.0
148.6%
Washington
Idaho
26
8853
293.7
125.8%
Adams
Illinois
127
65229
194.7
83.4%
Alexander
Illinois
64
25496
251.0
107.5%
Bond
Illinois
48
14540
330.1
141.4%
Boone
Illinois
27
15202
177.6
76.1%
Brown
Illinois
25
8053
310.4
133.0%
Bureau
Illinois
85
37600
226.1
96.8%
Calhoun
Illinois
21
8207
255.9
109.6%
Carroll
Illinois
32
17987
177.9
76.2%
Cass
Illinois
37
16425
225.3
96.5%
Champaign
Illinois
181
70578
256.5
109.9%
Christian
Illinois
81
38564
210.0
90.0%
Clark
Illinois
35
18842
185.8
79.6%
Clay
Illinois
50
18947
263.9
113.0%
Clinton
Illinois
45
22912
196.4
84.1%
Coles
Illinois
95
38470
246.9
105.8%
Cook
Illinois
9721
4063342
239.2
102.5%
Crawford
Illinois
61
21294
286.5
122.7%
Cumberland
Illinois
19
11698
162.4
69.6%
De Kalb
Illinois
117
34388
340.2
145.7%
De Witt
Illinois
42
18244
230.2
98.6%
Douglas
Illinois
48
17590
272.9
116.9%
Du Page
Illinois
253
103480
244.5
104.7%
Edgar
Illinois
55
24430
225.1
96.4%
Edwards
Illinois
11
8974
122.6
52.5%
Effingham
Illinois
67
22034
304.1
130.3%
Fayette
Illinois
66
29159
226.3
97.0%
Ford
Illinois
31
15007
206.6
88.5%
Franklin
Illinois
129
53137
242.8
104.0%
Fulton
Illinois
68
44627
152.4
65.3%
Gallatin
Illinois
23
11414
201.5
86.3%
Greene
Illinois
43
20292
211.9
90.8%
Grundy
Illinois
44
18398
239.2
102.4%
Hamilton
Illinois
45
13454
334.5
143.3%
Hancock
Illinois
65
26297
247.2
105.9%
Hardin
Illinois
28
7759
360.9
154.6%
Henderson
Illinois
18
8949
201.1
86.2%
Henry
Illinois
74
43798
169.0
72.4%
Iroquois
Illinois
61
32496
187.7
80.4%
Jackson
Illinois
89
37920
234.7
100.5%
Jasper
Illinois
42
13431
312.7
133.9%
Jefferson
Illinois
118
34375
343.3
147.0%
Jersey
Illinois
33
13636
242.0
103.7%
Jo Daviess
Illinois
49
19989
245.1
105.0%
Johnson
Illinois
30
10727
279.7
119.8%
Kane
Illinois
304
130206
233.5
100.0%
Kankakee
Illinois
131
60877
215.2
92.2%
Kendall
Illinois
26
11105
234.1
100.3%
Knox
Illinois
113
52250
216.3
92.6%
Lake
Illinois
257
121094
212.2
90.9%
La Salle
Illinois
250
97801
255.6
109.5%
Lawrence
Illinois
62
21075
294.2
126.0%
Lee
Illinois
84
34604
242.7
104.0%
Livingston
Illinois
87
38838
224.0
96.0%
Logan
Illinois
71
29438
241.2
103.3%
Macon
Illinois
176
84693
207.8
89.0%
Macoupin
Illinois
102
46304
220.3
94.4%
Madison
Illinois
346
149349
231.7
99.2%
Marion
Illinois
102
47989
212.5
91.0%
Marshall
Illinois
28
13179
212.5
91.0%
Mason
Illinois
46
15358
299.5
128.3%
Massac
Illinois
33
14937
220.9
94.6%
Mcdonough
Illinois
65
26944
241.2
103.3%
Mchenry
Illinois
89
37311
238.5
102.2%
Mclean
Illinois
169
73930
228.6
97.9%
Menard
Illinois
15
10663
140.7
60.3%
Mercer
Illinois
44
17701
248.6
106.5%
Monroe
Illinois
20
12754
156.8
67.2%
Montgomery
Illinois
87
34499
252.2
108.0%
Morgan
Illinois
80
36378
219.9
94.2%
Moultrie
Illinois
32
13477
237.4
101.7%
Ogle
Illinois
65
29869
217.6
93.2%
Peoria
Illinois
343
153374
223.6
95.8%
Perry
Illinois
46
23438
196.3
84.1%
Piatt
Illinois
39
14659
266.0
114.0%
Pike
Illinois
61
25340
240.7
103.1%
Pope
Illinois
15
7999
187.5
80.3%
Pulaski
Illinois
26
15875
163.8
70.2%
Putnam
Illinois
12
5289
226.9
97.2%
Randolph
Illinois
65
33608
193.4
82.8%
Richland
Illinois
43
17137
250.9
107.5%
Rock Island
Illinois
267
113323
235.6
100.9%
Saline
Illinois
80
38066
210.2
90.0%
Sangamon
Illinois
271
117912
229.8
98.4%
Schuyler
Illinois
22
11430
192.5
82.4%
Scott
Illinois
24
8176
293.5
125.7%
Shelby
Illinois
67
26290
254.8
109.2%
St.ark
Illinois
20
8881
225.2
96.5%
St Clair
Illinois
349
166899
209.1
89.6%
St.ephenson
Illinois
82
40646
201.7
86.4%
Tazewell
Illinois
101
58362
173.1
74.1%
Union
Illinois
42
21528
195.1
83.6%
Vermilion
Illinois
184
86791
212.0
90.8%
Wabash
Illinois
37
13724
269.6
115.5%
Warren
Illinois
45
21286
211.4
90.6%
Washington
Illinois
24
15801
151.9
65.1%
Wayne
Illinois
60
22092
271.6
116.3%
White
Illinois
53
20027
264.6
113.4%
Whiteside
Illinois
116
43338
267.7
114.7%
Will
Illinois
271
114210
237.3
101.6%
Williamson
Illinois
111
51424
215.9
92.5%
Winnebago
Illinois
285
121178
235.2
100.7%
Woodford
Illinois
50
19124
261.5
112.0%
Adams
Indiana
54
21254
254.1
108.8%
Allen
Indiana
291
155084
187.6
80.4%
Bartholomew
Indiana
68
28276
240.5
103.0%
Benton
Indiana
49
11117
440.8
188.8%
Blackford
Indiana
35
13783
253.9
108.8%
Boone
Indiana
41
22081
185.7
79.5%
Brown
Indiana
9
6189
145.4
62.3%
Carroll
Indiana
41
15410
266.1
114.0%
Cass
Indiana
88
36908
238.4
102.1%
Clark
Indiana
91
31020
293.4
125.7%
Clay
Indiana
61
25365
240.5
103.0%
Clinton
Indiana
63
28411
221.7
95.0%
Crawford
Indiana
31
10171
304.8
130.6%
Daviess
Indiana
59
26163
225.5
96.6%
Dearborn
Indiana
62
23053
268.9
115.2%
Decatur
Indiana
35
17722
197.5
84.6%
De Kalb
Indiana
47
24756
189.9
81.3%
Delaware
Indiana
158
74963
210.8
90.3%
Dubois
Indiana
43
22579
190.4
81.6%
Elkhart
Indiana
181
72634
249.2
106.7%
Fayette
Indiana
41
19411
211.2
90.5%
Floyd
Indiana
78
35061
222.5
95.3%
Fountain
Indiana
41
18299
224.1
96.0%
Franklin
Indiana
27
14412
187.3
80.2%
Fulton
Indiana
34
15577
218.3
93.5%
Gibson
Indiana
66
30709
214.9
92.1%
Grant
Indiana
113
55813
202.5
86.7%
Greene
Indiana
65
31330
207.5
88.9%
Hamilton
Indiana
48
24614
195.0
83.5%
Hancock
Indiana
33
17302
190.7
81.7%
Harrison
Indiana
53
17106
309.8
132.7%
Hendricks
Indiana
36
20151
178.7
76.5%
Henry
Indiana
87
40208
216.4
92.7%
Howard
Indiana
116
47752
242.9
104.1%
Huntington
Indiana
67
29931
223.8
95.9%
Jackson
Indiana
72
26612
270.6
115.9%
Jasper
Indiana
34
14397
236.2
101.2%
Jay
Indiana
56
22601
247.8
106.1%
Jefferson
Indiana
37
19912
185.8
79.6%
Jennings
Indiana
35
13680
255.8
109.6%
Johnson
Indiana
52
22493
231.2
99.0%
Knox
Indiana
109
43973
247.9
106.2%
Kosciusko
Indiana
46
29561
155.6
66.7%
Lagrange
Indiana
24
14352
167.2
71.6%
Lake
Indiana
815
293195
278.0
119.1%
La Porte
Indiana
183
63660
287.5
123.1%
Lawrence
Indiana
77
35045
219.7
94.1%
Madison
Indiana
228
88575
257.4
110.3%
Marion
Indiana
1055
460926
228.9
98.0%
Marshall
Indiana
63
25935
242.9
104.1%
Martin
Indiana
23
10300
223.3
95.7%
Miami
Indiana
66
27926
236.3
101.2%
Monroe
Indiana
92
36534
251.8
107.9%
Montgomery
Indiana
70
27231
257.1
110.1%
Morgan
Indiana
57
19801
287.9
123.3%
Newton
Indiana
31
10775
287.7
123.2%
Noble
Indiana
49
22776
215.1
92.2%
Ohio
Indiana
9
3782
238.0
101.9%
Orange
Indiana
38
17311
219.5
94.0%
Owen
Indiana
16
12090
132.3
56.7%
Parke
Indiana
34
17358
195.9
83.9%
Perry
Indiana
50
17770
281.4
120.5%
Pike
Indiana
30
17045
176.0
75.4%
Porter
Indiana
49
27836
176.0
75.4%
Posey
Indiana
56
19183
291.9
125.0%
Pulaski
Indiana
43
12056
356.7
152.8%
Putnam
Indiana
49
20839
235.1
100.7%
Randolph
Indiana
59
26766
220.4
94.4%
Ripley
Indiana
39
18898
206.4
88.4%
Rush
Indiana
31
18927
163.8
70.2%
Scott
Indiana
40
8978
445.5
190.8%
Shelby
Indiana
56
25953
215.8
92.4%
Spencer
Indiana
49
16211
302.3
129.5%
St.arke
Indiana
19
12258
155.0
66.4%
St.euben
Indiana
37
13740
269.3
115.3%
St Joseph
Indiana
430
161823
265.7
113.8%
Sullivan
Indiana
63
27014
233.2
99.9%
Switzerland
Indiana
16
8167
195.9
83.9%
Tippecanoe
Indiana
146
51020
286.2
122.6%
Tipton
Indiana
29
15135
191.6
82.1%
Union
Indiana
15
6017
249.3
106.8%
Vanderburgh
Indiana
298
130783
227.9
97.6%
Vermillion
Indiana
50
21787
229.5
98.3%
Vigo
Indiana
211
99709
211.6
90.6%
Wabash
Indiana
56
26601
210.5
90.2%
Warren
Indiana
25
9055
276.1
118.3%
Warrick
Indiana
54
19435
277.8
119.0%
Washington
Indiana
66
17008
388.1
166.2%
Wayne
Indiana
134
59229
226.2
96.9%
Wells
Indiana
28
19099
146.6
62.8%
White
Indiana
36
17037
211.3
90.5%
Whitley
Indiana
38
17001
223.5
95.7%
Allen
Kansas
37
19874
186.2
79.7%
Anderson
Kansas
26
11658
223.0
95.5%
Atchison
Kansas
45
22222
202.5
86.7%
Barber
Kansas
35
9073
385.8
165.2%
Barton
Kansas
64
25010
255.9
109.6%
Bourbon
Kansas
50
20944
238.7
102.3%
Brown
Kansas
45
17395
258.7
110.8%
Butler
Kansas
100
32013
312.4
133.8%
Chase
Kansas
15
6345
236.4
101.3%
Chautauqua
Kansas
28
9233
303.3
129.9%
Cherokee
Kansas
77
29817
258.2
110.6%
Cheyenne
Kansas
10
6221
160.7
68.9%
Clark
Kansas
12
4081
294.0
126.0%
Clay
Kansas
29
13281
218.4
93.5%
Cloud
Kansas
39
17247
226.1
96.9%
Coffey
Kansas
20
12278
162.9
69.8%
Comanche
Kansas
13
4412
294.7
126.2%
Cowley
Kansas
85
38139
222.9
95.5%
Crawford
Kansas
123
44191
278.3
119.2%
Decatur
Kansas
23
7434
309.4
132.5%
Dickinson
Kansas
56
22929
244.2
104.6%
Doniphan
Kansas
30
12936
231.9
99.3%
Douglas
Kansas
74
25171
294.0
125.9%
Edwards
Kansas
21
6377
329.3
141.1%
Elk
Kansas
19
8180
232.3
99.5%
Ellis
Kansas
41
17508
234.2
100.3%
Ellsworth
Kansas
18
9855
182.6
78.2%
Finney
Kansas
32
10092
317.1
135.8%
Ford
Kansas
55
17254
318.8
136.5%
Franklin
Kansas
34
20889
162.8
69.7%
Geary
Kansas
65
15222
427.0
182.9%
Gove
Kansas
12
4793
250.4
107.2%
Graham
Kansas
14
6071
230.6
98.8%
Grant
Kansas
5
1946
256.9
110.1%
Gray
Kansas
16
4773
335.2
143.6%
Greeley
Kansas
10
1638
610.5
261.5%
Greenwood
Kansas
41
16495
248.6
106.5%
Hamilton
Kansas
11
2645
415.9
178.1%
Harper
Kansas
21
12068
174.0
74.5%
Harvey
Kansas
67
21712
308.6
132.2%
Haskell
Kansas
10
2088
478.9
205.1%
Hodgeman
Kansas
8
3535
226.3
96.9%
Jackson
Kansas
43
13382
321.3
137.6%
Jefferson
Kansas
35
12718
275.2
117.9%
Jewell
Kansas
30
11970
250.6
107.4%
Johnson
Kansas
68
33327
204.0
87.4%
Kearny
Kansas
6
2525
237.6
101.8%
Kingman
Kansas
37
12001
308.3
132.1%
Kiowa
Kansas
10
5112
195.6
83.8%
Labette
Kansas
79
30352
260.3
111.5%
Lane
Kansas
4
2821
141.8
60.7%
Leavenworth
Kansas
93
41112
226.2
96.9%
Lincoln
Kansas
28
8338
335.8
143.8%
Linn
Kansas
23
11969
192.2
82.3%
Logan
Kansas
21
3688
569.4
243.9%
Lyon
Kansas
93
26424
352.0
150.8%
Marion
Kansas
37
18951
195.2
83.6%
Marshall
Kansas
36
20986
171.5
73.5%
Mcpherson
Kansas
58
24152
240.1
102.9%
Meade
Kansas
13
5522
235.4
100.8%
Miami
Kansas
31
19489
159.1
68.1%
Mitchell
Kansas
24
11339
211.7
90.7%
Montgomery
Kansas
138
49729
277.5
118.9%
Morris
Kansas
45
10363
434.2
186.0%
Morton
Kansas
4
2186
183.0
78.4%
Nemaha
Kansas
31
16761
185.0
79.2%
Neosho
Kansas
48
22210
216.1
92.6%
Ness
Kansas
16
6864
233.1
99.8%
Norton
Kansas
22
9831
223.8
95.9%
Osage
Kansas
30
15118
198.4
85.0%
Osborne
Kansas
28
9835
284.7
121.9%
Ottawa
Kansas
24
9224
260.2
111.5%
Pawnee
Kansas
18
10300
174.8
74.9%
Phillips
Kansas
20
10435
191.7
82.1%
Pottawatomie
Kansas
37
14015
264.0
113.1%
Pratt
Kansas
35
12348
283.4
121.4%
Rawlins
Kansas
10
6618
151.1
64.7%
Reno
Kansas
109
52165
209.0
89.5%
Republic
Kansas
28
13124
213.3
91.4%
Rice
Kansas
44
17213
255.6
109.5%
Riley
Kansas
62
20617
300.7
128.8%
Rooks
Kansas
20
8497
235.4
100.8%
Rush
Kansas
17
8285
205.2
87.9%
Russell
Kansas
40
13464
297.1
127.3%
Saline
Kansas
70
29535
237.0
101.5%
Scott
Kansas
9
3773
238.5
102.2%
Sedgwick
Kansas
397
143311
277.0
118.7%
Seward
Kansas
12
6540
183.5
78.6%
Shawnee
Kansas
172
91247
188.5
80.7%
Sheridan
Kansas
11
5312
207.1
88.7%
Sherman
Kansas
16
6421
249.2
106.7%
Smith
Kansas
31
10582
293.0
125.5%
St.afford
Kansas
25
10487
238.4
102.1%
St.anton
Kansas
2
1443
138.6
59.4%
St.evens
Kansas
13
3193
407.1
174.4%
Sumner
Kansas
70
26163
267.6
114.6%
Thomas
Kansas
22
6425
342.4
146.7%
Trego
Kansas
19
5822
326.3
139.8%
Wabaunsee
Kansas
12
9219
130.2
55.8%
Wallace
Kansas
3
2216
135.4
58.0%
Washington
Kansas
40
15921
251.2
107.6%
Wichita
Kansas
23
2185
1052.6
450.9%
Wilson
Kansas
32
17723
180.6
77.3%
Woodson
Kansas
26
8014
324.4
139.0%
Wyandotte
Kansas
364
145071
250.9
107.5%
Adair
Kentucky
45
18566
242.4
103.8%
Allen
Kentucky
34
15496
219.4
94.0%
Anderson
Kentucky
27
8936
302.1
129.4%
Ballard
Kentucky
27
9480
284.8
122.0%
Barren
Kentucky
52
27559
188.7
80.8%
Bath
Kentucky
29
11451
253.3
108.5%
Bell
Kentucky
91
43812
207.7
89.0%
Boone
Kentucky
26
10820
240.3
102.9%
Bourbon
Kentucky
33
17932
184.0
78.8%
Boyd
Kentucky
118
45938
256.9
110.0%
Boyle
Kentucky
39
17075
228.4
97.8%
Bracken
Kentucky
21
9389
223.7
95.8%
Breathitt
Kentucky
78
23946
325.7
139.5%
Breckinridge
Kentucky
51
17744
287.4
123.1%
Bullitt
Kentucky
23
9511
241.8
103.6%
Butler
Kentucky
33
14371
229.6
98.4%
Caldwell
Kentucky
23
14499
158.6
67.9%
Calloway
Kentucky
39
19041
204.8
87.7%
Campbell
Kentucky
174
71918
241.9
103.6%
Carlisle
Kentucky
25
7650
326.8
140.0%
Carroll
Kentucky
24
8657
277.2
118.8%
Carter
Kentucky
60
25545
234.9
100.6%
Casey
Kentucky
44
19962
220.4
94.4%
Christian
Kentucky
48
36129
132.9
56.9%
Clark
Kentucky
46
17988
255.7
109.5%
Clay
Kentucky
68
23901
284.5
121.9%
Clinton
Kentucky
24
10279
233.5
100.0%
Crittenden
Kentucky
29
12115
239.4
102.5%
Cumberland
Kentucky
35
11923
293.6
125.7%
Daviess
Kentucky
129
52335
246.5
105.6%
Edmonson
Kentucky
27
11344
238.0
102.0%
Elliott
Kentucky
25
8713
286.9
122.9%
Estill
Kentucky
51
17978
283.7
121.5%
Fayette
Kentucky
206
78899
261.1
111.8%
Fleming
Kentucky
38
13327
285.1
122.1%
Floyd
Kentucky
117
52986
220.8
94.6%
Franklin
Kentucky
46
23308
197.4
84.5%
Fulton
Kentucky
34
15413
220.6
94.5%
Gallatin
Kentucky
9
4307
209.0
89.5%
Garrard
Kentucky
23
11910
193.1
82.7%
Grant
Kentucky
17
9876
172.1
73.7%
Graves
Kentucky
71
31763
223.5
95.7%
Grayson
Kentucky
49
17562
279.0
119.5%
Green
Kentucky
23
12321
186.7
80.0%
Greenup
Kentucky
61
24917
244.8
104.9%
Hancock
Kentucky
10
6807
146.9
62.9%
Hardin
Kentucky
80
29108
274.8
117.7%
Harlan
Kentucky
183
75275
243.1
104.1%
Harrison
Kentucky
31
15124
205.0
87.8%
Hart
Kentucky
36
17239
208.8
89.5%
Henderson
Kentucky
70
27020
259.1
111.0%
Henry
Kentucky
30
12220
245.5
105.2%
Hickman
Kentucky
18
9142
196.9
84.3%
Hopkins
Kentucky
93
37789
246.1
105.4%
Jackson
Kentucky
34
16339
208.1
89.1%
Jefferson
Kentucky
896
385392
232.5
99.6%
Jessamine
Kentucky
25
12174
205.4
88.0%
Johnson
Kentucky
73
25771
283.3
121.3%
Kenton
Kentucky
225
93139
241.6
103.5%
Knott
Kentucky
68
20007
339.9
145.6%
Knox
Kentucky
81
31029
261.0
111.8%
Larue
Kentucky
22
9622
228.6
97.9%
Laurel
Kentucky
65
25640
253.5
108.6%
Lawrence
Kentucky
42
17275
243.1
104.1%
Lee
Kentucky
42
10860
386.7
165.7%
Leslie
Kentucky
40
14981
267.0
114.4%
Letcher
Kentucky
119
40592
293.2
125.6%
Lewis
Kentucky
48
15686
306.0
131.1%
Lincoln
Kentucky
36
19859
181.3
77.7%
Livingston
Kentucky
22
9127
241.0
103.3%
Logan
Kentucky
45
23345
192.8
82.6%
Lyon
Kentucky
15
9067
165.4
70.9%
Madison
Kentucky
54
28541
189.2
81.0%
Magoffin
Kentucky
38
17490
217.3
93.1%
Marion
Kentucky
32
16913
189.2
81.0%
Marshall
Kentucky
43
16602
259.0
110.9%
Martin
Kentucky
27
10970
246.1
105.4%
Mason
Kentucky
51
19066
267.5
114.6%
Mccracken
Kentucky
102
48534
210.2
90.0%
Mccreary
Kentucky
31
16451
188.4
80.7%
Mclean
Kentucky
27
11446
235.9
101.0%
Meade
Kentucky
23
8827
260.6
111.6%
Menifee
Kentucky
16
5691
281.1
120.4%
Mercer
Kentucky
67
14629
458.0
196.2%
Metcalfe
Kentucky
17
10853
156.6
67.1%
Monroe
Kentucky
36
14070
255.9
109.6%
Montgomery
Kentucky
30
12280
244.3
104.6%
Morgan
Kentucky
43
16827
255.5
109.5%
Muhlenberg
Kentucky
81
37554
215.7
92.4%
Nelson
Kentucky
37
18004
205.5
88.0%
Nicholas
Kentucky
20
8617
232.1
99.4%
Ohio
Kentucky
43
24421
176.1
75.4%
Oldham
Kentucky
14
10716
130.6
56.0%
Owen
Kentucky
17
10942
155.4
66.6%
Owsley
Kentucky
23
8957
256.8
110.0%
Pendleton
Kentucky
19
10392
182.8
78.3%
Perry
Kentucky
144
47828
301.1
129.0%
Pike
Kentucky
176
71122
247.5
106.0%
Powell
Kentucky
20
7671
260.7
111.7%
Pulaski
Kentucky
119
39863
298.5
127.9%
Robertson
Kentucky
6
3419
175.5
75.2%
Rockcastle
Kentucky
40
17165
233.0
99.8%
Rowan
Kentucky
49
12734
384.8
164.8%
Russell
Kentucky
30
13615
220.3
94.4%
Scott
Kentucky
38
14314
265.5
113.7%
Shelby
Kentucky
37
17759
208.3
89.2%
Simpson
Kentucky
19
11752
161.7
69.3%
Spencer
Kentucky
15
6757
222.0
95.1%
Taylor
Kentucky
29
13556
213.9
91.6%
Todd
Kentucky
18
14234
126.5
54.2%
Trigg
Kentucky
19
12784
148.6
63.7%
Trimble
Kentucky
11
5601
196.4
84.1%
Union
Kentucky
38
17411
218.3
93.5%
Warren
Kentucky
84
36631
229.3
98.2%
Washington
Kentucky
28
12965
216.0
92.5%
Wayne
Kentucky
40
17204
232.5
99.6%
Webster
Kentucky
34
19198
177.1
75.9%
Whitley
Kentucky
102
33186
307.4
131.7%
Wolfe
Kentucky
21
9997
210.1
90.0%
Woodford
Kentucky
30
11847
253.2
108.5%
Acadia
Louisiana
86
46260
185.9
79.6%
Allen
Louisiana
31
17540
176.7
75.7%
Ascension
Louisiana
31
21215
146.1
62.6%
Assumption
Louisiana
23
18541
124.0
53.1%
Avoyelles
Louisiana
74
39256
188.5
80.7%
Beauregard
Louisiana
27
14847
181.9
77.9%
Bienville
Louisiana
36
23933
150.4
64.4%
Bossier
Louisiana
29
33162
87.4
37.5%
Caddo
Louisiana
320
150203
213.0
91.3%
Calcasieu
Louisiana
135
56506
238.9
102.3%
Caldwell
Louisiana
22
12046
182.6
78.2%
Cameron
Louisiana
17
7203
236.0
101.1%
Catahoula
Louisiana
30
14618
205.2
87.9%
Claiborne
Louisiana
54
29855
180.9
77.5%
Concordia
Louisiana
12
14562
82.4
35.3%
Desoto
Louisiana
44
31803
138.4
59.3%
East Baton Rouge
Louisiana
150
88415
169.7
72.7%
East Carroll
Louisiana
18
19023
94.6
40.5%
East Feliciana
Louisiana
11
18039
61.0
26.1%
Evangeline
Louisiana
34
30497
111.5
47.8%
Franklin
Louisiana
50
32382
154.4
66.1%
Grant
Louisiana
35
15933
219.7
94.1%
Iberia
Louisiana
32
37183
86.1
36.9%
Iberville
Louisiana
38
27721
137.1
58.7%
Jackson
Louisiana
48
17807
269.6
115.5%
Jefferson
Louisiana
89
50427
176.5
75.6%
Jefferson Davis
Louisiana
44
24191
181.9
77.9%
Lafayette
Louisiana
81
43941
184.3
79.0%
Lafourche
Louisiana
57
38615
147.6
63.2%
La Salle
Louisiana
29
10959
264.6
113.4%
Lincoln
Louisiana
41
24790
165.4
70.8%
Livingston
Louisiana
32
17790
179.9
77.0%
Madison
Louisiana
18
18443
97.6
41.8%
Morehouse
Louisiana
40
27571
145.1
62.1%
Natchitoches
Louisiana
71
40997
173.2
74.2%
Orleans
Louisiana
773
494537
156.3
67.0%
Ouachita
Louisiana
114
59168
192.7
82.5%
Plaquemines
Louisiana
14
12318
113.7
48.7%
Pointe Coupee
Louisiana
30
24004
125.0
53.5%
Rapides
Louisiana
146
73370
199.0
85.2%
Red River
Louisiana
34
15881
214.1
91.7%
Richland
Louisiana
52
28829
180.4
77.3%
Sabine
Louisiana
68
23586
288.3
123.5%
St Bernard
Louisiana
11
7280
151.1
64.7%
St Charles
Louisiana
16
12321
129.9
55.6%
St Helena
Louisiana
4
9542
41.9
18.0%
St James
Louisiana
27
16596
162.7
69.7%
St John The Baptist
Louisiana
23
14766
155.8
66.7%
St Landry
Louisiana
81
71481
113.3
48.5%
St Martin
Louisiana
32
26394
121.2
51.9%
St Mary
Louisiana
59
31458
187.6
80.3%
St Tammany
Louisiana
37
23624
156.6
67.1%
Tangipahoa
Louisiana
78
45519
171.4
73.4%
Tensas
Louisiana
14
15940
87.8
37.6%
Terrebonne
Louisiana
64
35880
178.4
76.4%
Union
Louisiana
30
20943
143.2
61.4%
Vermilion
Louisiana
82
37750
217.2
93.0%
Vernon
Louisiana
45
19142
235.1
100.7%
Washington
Louisiana
62
34443
180.0
77.1%
Webster
Louisiana
44
33676
130.7
56.0%
West Baton Rouge
Louisiana
9
11263
79.9
34.2%
West Carroll
Louisiana
50
19252
259.7
111.2%
West Feliciana
Louisiana
11
11720
93.9
40.2%
Winn
Louisiana
24
16923
141.8
60.7%
Barnstable
Massachusetts
58
37295
155.5
66.6%
Berkshire
Massachusetts
323
122273
264.2
113.2%
Bristol
Massachusetts
870
364637
238.6
102.2%
Dukes
Massachusetts
21
5669
370.4
158.7%
Essex
Massachusetts
1081
496313
217.8
93.3%
Franklin
Massachusetts
144
49453
291.2
124.7%
Hampden
Massachusetts
819
332107
246.6
105.6%
Hampshire
Massachusetts
200
72461
276.0
118.2%
Middlesex
Massachusetts
2246
971390
231.2
99.0%
Nantucket
Massachusetts
8
3401
235.2
100.8%
Norfolk
Massachusetts
688
325180
211.6
90.6%
Plymouth
Massachusetts
356
168824
210.9
90.3%
Suffolk
Massachusetts
1856
863248
215.0
92.1%
Worcester
Massachusetts
1282
504470
254.1
108.9%
Allegany
Maryland
282
86973
324.2
138.9%
Anne Arundel
Maryland
146
68375
213.5
91.5%
Baltimore
Maryland
367
155825
235.5
100.9%
Baltimore (city)
Maryland
2031
859100
236.4
101.3%
Calvert
Maryland
20
10484
190.8
81.7%
Caroline
Maryland
29
17549
165.3
70.8%
Carroll
Maryland
88
39054
225.3
96.5%
Cecil
Maryland
63
26407
238.6
102.2%
Charles
Maryland
38
17612
215.8
92.4%
Dorchester
Maryland
61
28006
217.8
93.3%
Frederick
Maryland
141
57312
246.0
105.4%
Garrett
Maryland
52
21981
236.6
101.3%
Harford
Maryland
109
35060
310.9
133.2%
Howard
Maryland
43
17175
250.4
107.2%
Kent
Maryland
29
13465
215.4
92.3%
Montgomery
Maryland
189
83912
225.2
96.5%
Prince Georges
Maryland
212
89490
236.9
101.5%
Queen Annes
Maryland
27
14476
186.5
79.9%
Somerset
Maryland
51
20965
243.3
104.2%
St Marys
Maryland
33
14626
225.6
96.6%
Talbot
Maryland
29
18784
154.4
66.1%
Washington
Maryland
174
68838
252.8
108.3%
Wicomico
Maryland
69
34530
199.8
85.6%
Worcester
Maryland
40
21245
188.3
80.6%
Androscoggin
Maine
203
76679
264.7
113.4%
Aroostook
Maine
223
94436
236.1
101.1%
Cumberland
Maine
389
146000
266.4
114.1%
Franklin
Maine
56
19896
281.5
120.6%
Hancock
Maine
67
32422
206.6
88.5%
Kennebec
Maine
209
77231
270.6
115.9%
Knox
Maine
63
27191
231.7
99.2%
Lincoln
Maine
34
16294
208.7
89.4%
Oxford
Maine
127
42662
297.7
127.5%
Penobscot
Maine
238
97104
245.1
105.0%
Piscataquis
Maine
57
18467
308.7
132.2%
Sagadahoc
Maine
38
19123
198.7
85.1%
Somerset
Maine
93
38245
243.2
104.2%
Waldo
Maine
53
21159
250.5
107.3%
Washington
Maine
76
37767
201.2
86.2%
York
Maine
206
82550
249.5
106.9%
Alcona
Michigan
16
5463
292.9
125.5%
Alger
Michigan
29
10167
285.2
122.2%
Allegan
Michigan
87
41839
207.9
89.1%
Alpena
Michigan
46
20766
221.5
94.9%
Antrim
Michigan
33
10964
301.0
128.9%
Arenac
Michigan
24
9233
259.9
111.3%
Baraga
Michigan
24
9356
256.5
109.9%
Barry
Michigan
46
22613
203.4
87.1%
Bay
Michigan
182
74981
242.7
104.0%
Benzie
Michigan
16
7800
205.1
87.9%
Berrien
Michigan
237
89117
265.9
113.9%
Branch
Michigan
51
25845
197.3
84.5%
Calhoun
Michigan
207
94206
219.7
94.1%
Cass
Michigan
36
21910
164.3
70.4%
Charlevoix
Michigan
33
13031
253.2
108.5%
Cheboygan
Michigan
43
13644
315.2
135.0%
Chippewa
Michigan
72
27807
258.9
110.9%
Clare
Michigan
26
9163
283.7
121.5%
Clinton
Michigan
46
26671
172.5
73.9%
Crawford
Michigan
11
3765
292.2
125.1%
Delta
Michigan
106
34037
311.4
133.4%
Dickinson
Michigan
88
28731
306.3
131.2%
Eaton
Michigan
64
34124
187.6
80.3%
Emmet
Michigan
33
15791
209.0
89.5%
Genesee
Michigan
498
227944
218.5
93.6%
Gladwin
Michigan
27
9385
287.7
123.2%
Gogebic
Michigan
127
31797
399.4
171.1%
Grand Traverse
Michigan
46
23390
196.7
84.2%
Gratiot
Michigan
51
32205
158.4
67.8%
Hillsdale
Michigan
55
29092
189.1
81.0%
Houghton
Michigan
130
47631
272.9
116.9%
Huron
Michigan
77
32584
236.3
101.2%
Ingham
Michigan
322
130616
246.5
105.6%
Ionia
Michigan
91
35710
254.8
109.2%
Iosco
Michigan
16
8560
186.9
80.1%
Iron
Michigan
82
20243
405.1
173.5%
Isabella
Michigan
52
25982
200.1
85.7%
Jackson
Michigan
186
93108
199.8
85.6%
Kalamazoo
Michigan
246
100085
245.8
105.3%
Kalkaska
Michigan
15
5159
290.8
124.5%
Kent
Michigan
583
246338
236.7
101.4%
Keweenaw
Michigan
11
4004
274.7
117.7%
Lake
Michigan
9
4798
187.6
80.3%
Lapeer
Michigan
65
32116
202.4
86.7%
Leelanau
Michigan
11
8436
130.4
55.9%
Lenawee
Michigan
133
53110
250.4
107.3%
Livingston
Michigan
46
20863
220.5
94.4%
Luce
Michigan
11
7423
148.2
63.5%
Mackinac
Michigan
20
9438
211.9
90.8%
Macomb
Michigan
252
107638
234.1
100.3%
Manistee
Michigan
48
18450
260.2
111.4%
Marquette
Michigan
107
47144
227.0
97.2%
Mason
Michigan
56
19378
289.0
123.8%
Mecosta
Michigan
44
16902
260.3
111.5%
Menominee
Michigan
61
24883
245.1
105.0%
Midland
Michigan
64
27094
236.2
101.2%
Missaukee
Michigan
19
8034
236.5
101.3%
Monroe
Michigan
131
58620
223.5
95.7%
Montcalm
Michigan
56
28581
195.9
83.9%
Montmorency
Michigan
10
3840
260.4
111.5%
Muskegon
Michigan
274
94501
289.9
124.2%
Newaygo
Michigan
44
19286
228.1
97.7%
Oakland
Michigan
600
254068
236.2
101.2%
Oceana
Michigan
37
14812
249.8
107.0%
Ogemaw
Michigan
15
8720
172.0
73.7%
Ontonagon
Michigan
39
11359
343.3
147.1%
Osceola
Michigan
32
13309
240.4
103.0%
Oscoda
Michigan
6
2543
235.9
101.1%
Otsego
Michigan
11
5827
188.8
80.9%
Ottawa
Michigan
166
59660
278.2
119.2%
Presque Isle
Michigan
32
12250
261.2
111.9%
Roscommon
Michigan
13
3668
354.4
151.8%
Saginaw
Michigan
317
130468
243.0
104.1%
Sanilac
Michigan
39
30114
129.5
55.5%
Schoolcraft
Michigan
34
9524
357.0
152.9%
Shiawassee
Michigan
81
41207
196.6
84.2%
St Clair
Michigan
195
76222
255.8
109.6%
St Joseph
Michigan
60
31749
189.0
81.0%
Tuscola
Michigan
62
35694
173.7
74.4%
Van Buren
Michigan
85
35111
242.1
103.7%
Washtenaw
Michigan
201
80810
248.7
106.5%
Wayne
Michigan
5104
2015623
253.2
108.5%
Wexford
Michigan
48
17976
267.0
114.4%
Aitkin
Minnesota
50
17865
279.9
119.9%
Anoka
Minnesota
32
22443
142.6
61.1%
Becker
Minnesota
61
26562
229.7
98.4%
Beltrami
Minnesota
81
26107
310.3
132.9%
Benton
Minnesota
47
16106
291.8
125.0%
Big St.one
Minnesota
38
10447
363.7
155.8%
Blue Earth
Minnesota
73
36203
201.6
86.4%
Brown
Minnesota
42
25544
164.4
70.4%
Carlton
Minnesota
66
24212
272.6
116.8%
Carver
Minnesota
23
17606
130.6
56.0%
Cass
Minnesota
43
20646
208.3
89.2%
Chippewa
Minnesota
46
16927
271.8
116.4%
Chisago
Minnesota
25
13124
190.5
81.6%
Clay
Minnesota
59
25337
232.9
99.7%
Clearwater
Minnesota
40
11153
358.6
153.6%
Cook
Minnesota
8
3030
264.0
113.1%
Cottonwood
Minnesota
31
16143
192.0
82.3%
Crow Wing
Minnesota
84
30226
277.9
119.0%
Dakota
Minnesota
86
39660
216.8
92.9%
Dodge
Minnesota
19
12931
146.9
62.9%
Douglas
Minnesota
29
20369
142.4
61.0%
Faribault
Minnesota
54
23941
225.6
96.6%
Fillmore
Minnesota
54
25830
209.1
89.6%
Freeborn
Minnesota
84
31780
264.3
113.2%
Goodhue
Minnesota
72
31564
228.1
97.7%
Grant
Minnesota
18
9828
183.2
78.5%
Hennepin
Minnesota
1340
568899
235.5
100.9%
Houston
Minnesota
27
14735
183.2
78.5%
Hubbard
Minnesota
26
11085
234.6
100.5%
Isanti
Minnesota
20
12950
154.4
66.2%
Itasca
Minnesota
90
32996
272.8
116.8%
Jackson
Minnesota
38
16805
226.1
96.9%
Kanabec
Minnesota
17
9651
176.1
75.5%
Kandiyohi
Minnesota
54
26524
203.6
87.2%
Kittson
Minnesota
26
10717
242.6
103.9%
Koochiching
Minnesota
58
16930
342.6
146.7%
Lac Qui Parle
Minnesota
45
15509
290.2
124.3%
Lake
Minnesota
18
6956
258.8
110.8%
Lake Of The Woods
Minnesota
16
5975
267.8
114.7%
Le Sueur
Minnesota
27
19227
140.4
60.2%
Lincoln
Minnesota
28
10797
259.3
111.1%
Lyon
Minnesota
62
21569
287.4
123.1%
Mahnomen
Minnesota
24
8054
298.0
127.6%
Marshall
Minnesota
31
18364
168.8
72.3%
Martin
Minnesota
51
24656
206.8
88.6%
Mcleod
Minnesota
45
21380
210.5
90.2%
Meeker
Minnesota
40
19277
207.5
88.9%
Mille Lacs
Minnesota
38
15558
244.2
104.6%
Morrison
Minnesota
68
27473
247.5
106.0%
Mower
Minnesota
88
36113
243.7
104.4%
Murray
Minnesota
27
15060
179.3
76.8%
Nicollet
Minnesota
29
18282
158.6
67.9%
Nobles
Minnesota
40
21215
188.5
80.8%
Norman
Minnesota
38
14746
257.7
110.4%
Olmsted
Minnesota
81
42658
189.9
81.3%
Otter Tail
Minnesota
87
53192
163.6
70.1%
Pennington
Minnesota
35
12913
271.0
116.1%
Pine
Minnesota
48
21478
223.5
95.7%
Pipestone
Minnesota
38
13794
275.5
118.0%
Polk
Minnesota
83
37734
220.0
94.2%
Pope
Minnesota
39
13544
288.0
123.3%
Ramsey
Minnesota
746
309935
240.7
103.1%
Red Lake
Minnesota
17
7413
229.3
98.2%
Redwood
Minnesota
59
22290
264.7
113.4%
Renville
Minnesota
58
24625
235.5
100.9%
Rice
Minnesota
60
32160
186.6
79.9%
Rock
Minnesota
17
10933
155.5
66.6%
Roseau
Minnesota
27
15103
178.8
76.6%
Scott
Minnesota
21
15585
134.7
57.7%
Sherburne
Minnesota
30
10456
286.9
122.9%
Sibley
Minnesota
30
16625
180.5
77.3%
St.earns
Minnesota
120
67200
178.6
76.5%
St.eele
Minnesota
43
19749
217.7
93.3%
St.evens
Minnesota
22
11039
199.3
85.4%
St Louis
Minnesota
573
206917
276.9
118.6%
Swift
Minnesota
48
15469
310.3
132.9%
Todd
Minnesota
54
27438
196.8
84.3%
Traverse
Minnesota
19
8283
229.4
98.3%
Wabasha
Minnesota
42
17653
237.9
101.9%
Wadena
Minnesota
41
12772
321.0
137.5%
Waseca
Minnesota
31
15186
204.1
87.4%
Washington
Minnesota
58
26430
219.4
94.0%
Watonwan
Minnesota
34
13902
244.6
104.8%
Wilkin
Minnesota
20
10475
190.9
81.8%
Winona
Minnesota
64
37795
169.3
72.5%
Wright
Minnesota
42
27550
152.5
65.3%
Yellow Medicine
Minnesota
34
16917
201.0
86.1%
Adair
Missouri
44
20246
217.3
93.1%
Andrew
Missouri
29
13015
222.8
95.4%
Atchison
Missouri
41
12897
317.9
136.2%
Audrain
Missouri
57
22673
251.4
107.7%
Barry
Missouri
45
23546
191.1
81.9%
Barton
Missouri
36
14148
254.5
109.0%
Bates
Missouri
38
19531
194.6
83.3%
Benton
Missouri
25
11142
224.4
96.1%
Bollinger
Missouri
17
12898
131.8
56.5%
Boone
Missouri
84
34991
240.1
102.8%
Buchanan
Missouri
216
94067
229.6
98.4%
Butler
Missouri
61
34276
178.0
76.2%
Caldwell
Missouri
38
11629
326.8
140.0%
Callaway
Missouri
43
23094
186.2
79.8%
Camden
Missouri
24
8971
267.5
114.6%
Cape Girardeau
Missouri
80
37775
211.8
90.7%
Carroll
Missouri
31
17814
174.0
74.5%
Carter
Missouri
11
6226
176.7
75.7%
Cass
Missouri
44
19534
225.2
96.5%
Cedar
Missouri
33
11697
282.1
120.8%
Chariton
Missouri
40
18084
221.2
94.7%
Christian
Missouri
23
13538
169.9
72.8%
Clark
Missouri
12
10166
118.0
50.6%
Clay
Missouri
61
30417
200.5
85.9%
Clinton
Missouri
37
13261
279.0
119.5%
Cole
Missouri
83
34912
237.7
101.8%
Cooper
Missouri
47
18075
260.0
111.4%
Crawford
Missouri
41
12693
323.0
138.4%
Dade
Missouri
26
11248
231.2
99.0%
Dallas
Missouri
21
11523
182.2
78.1%
Daviess
Missouri
35
13398
261.2
111.9%
De Kalb
Missouri
19
9751
194.9
83.5%
Dent
Missouri
35
11763
297.5
127.5%
Douglas
Missouri
29
15600
185.9
79.6%
Dunklin
Missouri
95
44957
211.3
90.5%
Franklin
Missouri
67
33868
197.8
84.7%
Gasconade
Missouri
24
12414
193.3
82.8%
Gentry
Missouri
35
13359
262.0
112.2%
Greene
Missouri
186
90541
205.4
88.0%
Grundy
Missouri
34
15716
216.3
92.7%
Harrison
Missouri
30
16525
181.5
77.8%
Henry
Missouri
53
22313
237.5
101.7%
Hickory
Missouri
8
6506
123.0
52.7%
Holt
Missouri
30
12476
240.5
103.0%
Howard
Missouri
27
13026
207.3
88.8%
Howell
Missouri
73
22270
327.8
140.4%
Iron
Missouri
25
10440
239.5
102.6%
Jackson
Missouri
1045
477828
218.7
93.7%
Jasper
Missouri
194
78705
246.5
105.6%
Jefferson
Missouri
74
32023
231.1
99.0%
Johnson
Missouri
46
21617
212.8
91.2%
Knox
Missouri
16
8878
180.2
77.2%
Laclede
Missouri
43
18718
229.7
98.4%
Lafayette
Missouri
82
27856
294.4
126.1%
Lawrence
Missouri
38
24637
154.2
66.1%
Lewis
Missouri
25
11490
217.6
93.2%
Lincoln
Missouri
35
14395
243.1
104.1%
Linn
Missouri
47
21416
219.5
94.0%
Livingston
Missouri
29
18000
161.1
69.0%
Macon
Missouri
42
21396
196.3
84.1%
Madison
Missouri
24
9656
248.6
106.5%
Maries
Missouri
15
8638
173.7
74.4%
Marion
Missouri
72
31576
228.0
97.7%
Mcdonald
Missouri
40
15749
254.0
108.8%
Mercer
Missouri
24
8766
273.8
117.3%
Miller
Missouri
23
14798
155.4
66.6%
Mississippi
Missouri
43
23149
185.8
79.6%
Moniteau
Missouri
27
11775
229.3
98.2%
Monroe
Missouri
19
13195
144.0
61.7%
Montgomery
Missouri
27
12442
217.0
93.0%
Morgan
Missouri
30
11140
269.3
115.4%
New Madrid
Missouri
81
39787
203.6
87.2%
Newton
Missouri
58
29039
199.7
85.6%
Nodaway
Missouri
62
25556
242.6
103.9%
Oregon
Missouri
28
13390
209.1
89.6%
Osage
Missouri
28
12375
226.3
96.9%
Ozark
Missouri
25
10766
232.2
99.5%
Pemiscot
Missouri
87
46857
185.7
79.5%
Perry
Missouri
26
15358
169.3
72.5%
Pettis
Missouri
61
33336
183.0
78.4%
Phelps
Missouri
44
17437
252.3
108.1%
Pike
Missouri
31
18327
169.1
72.5%
Platte
Missouri
34
13862
245.3
105.1%
Polk
Missouri
42
17400
241.4
103.4%
Pulaski
Missouri
22
10775
204.2
87.5%
Putnam
Missouri
17
11327
150.1
64.3%
Ralls
Missouri
15
10040
149.4
64.0%
Randolph
Missouri
48
24458
196.3
84.1%
Ray
Missouri
51
18584
274.4
117.6%
Reynolds
Missouri
21
9370
224.1
96.0%
Ripley
Missouri
26
12606
206.3
88.3%
Saline
Missouri
74
29416
251.6
107.8%
Schuyler
Missouri
20
6627
301.8
129.3%
Scotland
Missouri
19
8557
222.0
95.1%
Scott
Missouri
74
30377
243.6
104.3%
Shannon
Missouri
20
11831
169.0
72.4%
Shelby
Missouri
14
11224
124.7
53.4%
St Charles
Missouri
43
25562
168.2
72.1%
St Clair
Missouri
25
13146
190.2
81.5%
St.e. Genevieve
Missouri
27
10905
247.6
106.1%
St Francois
Missouri
71
35950
197.5
84.6%
St Louis
Missouri
453
274230
165.2
70.8%
St Louis (city)
Missouri
1636
816048
200.5
85.9%
St.oddard
Missouri
53
33009
160.6
68.8%
St.one
Missouri
26
11298
230.1
98.6%
Sullivan
Missouri
34
13701
248.2
106.3%
Taney
Missouri
20
10323
193.7
83.0%
Texas
Missouri
48
19813
242.3
103.8%
Vernon
Missouri
66
25586
258.0
110.5%
Warren
Missouri
16
7734
206.9
88.6%
Washington
Missouri
39
17492
223.0
95.5%
Wayne
Missouri
28
12794
218.9
93.7%
Webster
Missouri
31
17226
180.0
77.1%
Worth
Missouri
15
6345
236.4
101.3%
Wright
Missouri
39
17967
217.1
93.0%
Adams
Mississippi
36
27238
132.2
56.6%
Alcorn
Mississippi
59
26969
218.8
93.7%
Amite
Mississippi
31
21892
141.6
60.7%
Attala
Mississippi
51
30227
168.7
72.3%
Benton
Mississippi
24
10429
230.1
98.6%
Bolivar
Mississippi
67
67574
99.2
42.5%
Calhoun
Mississippi
52
20893
248.9
106.6%
Carroll
Mississippi
29
20651
140.4
60.2%
Chickasaw
Mississippi
37
21427
172.7
74.0%
Choctaw
Mississippi
31
13548
228.8
98.0%
Claiborne
Mississippi
18
12810
140.5
60.2%
Clarke
Mississippi
32
20596
155.4
66.6%
Clay
Mississippi
30
19030
157.6
67.5%
Coahoma
Mississippi
50
48333
103.4
44.3%
Copiah
Mississippi
58
33974
170.7
73.1%
Covington
Mississippi
32
17030
187.9
80.5%
De Soto
Mississippi
26
26663
97.5
41.8%
Forrest
Mississippi
88
34901
252.1
108.0%
Franklin
Mississippi
30
12504
239.9
102.8%
George
Mississippi
22
8704
252.8
108.3%
Greene
Mississippi
23
9512
241.8
103.6%
Grenada
Mississippi
42
19052
220.4
94.4%
Hancock
Mississippi
23
11328
203.0
87.0%
Harrison
Mississippi
119
50799
234.3
100.3%
Hinds
Mississippi
222
107273
206.9
88.6%
Holmes
Mississippi
44
39710
110.8
47.5%
Humphreys
Mississippi
42
26257
160.0
68.5%
Issaquena
Mississippi
7
6433
108.8
46.6%
Itawamba
Mississippi
45
19922
225.9
96.8%
Jackson
Mississippi
61
20601
296.1
126.8%
Jasper
Mississippi
35
19484
179.6
76.9%
Jefferson
Mississippi
16
13969
114.5
49.1%
Jefferson Davis
Mississippi
9
15869
56.7
24.3%
Jones
Mississippi
84
49227
170.6
73.1%
Kemper
Mississippi
33
21867
150.9
64.6%
Lafayette
Mississippi
46
21257
216.4
92.7%
Lamar
Mississippi
40
12096
330.7
141.6%
Lauderdale
Mississippi
111
58247
190.6
81.6%
Lawrence
Mississippi
26
13983
185.9
79.6%
Leake
Mississippi
42
24570
170.9
73.2%
Lee
Mississippi
101
38838
260.1
111.4%
Leflore
Mississippi
59
53406
110.5
47.3%
Lincoln
Mississippi
43
27506
156.3
67.0%
Lowndes
Mississippi
55
35245
156.1
66.8%
Madison
Mississippi
37
37504
98.7
42.3%
Marion
Mississippi
44
24085
182.7
78.3%
Marshall
Mississippi
18
25522
70.5
30.2%
Monroe
Mississippi
62
37648
164.7
70.5%
Montgomery
Mississippi
37
15703
235.6
100.9%
Neshoba
Mississippi
33
27882
118.4
50.7%
Newton
Mississippi
45
24249
185.6
79.5%
Noxubee
Mississippi
25
25669
97.4
41.7%
Oktibbeha
Mississippi
38
22151
171.5
73.5%
Panola
Mississippi
37
34421
107.5
46.0%
Pearl River
Mississippi
48
19125
251.0
107.5%
Perry
Mississippi
9
9292
96.9
41.5%
Pike
Mississippi
70
35002
200.0
85.7%
Pontotoc
Mississippi
43
22904
187.7
80.4%
Prentiss
Mississippi
38
20921
181.6
77.8%
Quitman
Mississippi
35
27191
128.7
55.1%
Rankin
Mississippi
21
27934
75.2
32.2%
Scott
Mississippi
37
23144
159.9
68.5%
Sharkey
Mississippi
10
15433
64.8
27.8%
Simpson
Mississippi
43
22024
195.2
83.6%
Smith
Mississippi
40
19403
206.2
88.3%
St.one
Mississippi
14
6155
227.5
97.4%
Sunflower
Mississippi
57
61007
93.4
40.0%
Tallahatchie
Mississippi
30
34166
87.8
37.6%
Tate
Mississippi
19
19309
98.4
42.1%
Tippah
Mississippi
52
19680
264.2
113.2%
Tishomingo
Mississippi
43
16974
253.3
108.5%
Tunica
Mississippi
15
22610
66.3
28.4%
Union
Mississippi
53
21867
242.4
103.8%
Walthall
Mississippi
22
17534
125.5
53.7%
Warren
Mississippi
52
39595
131.3
56.3%
Washington
Mississippi
71
67576
105.1
45.0%
Wayne
Mississippi
30
16928
177.2
75.9%
Webster
Mississippi
26
14160
183.6
78.7%
Wilkinson
Mississippi
23
15955
144.2
61.7%
Winston
Mississippi
40
22751
175.8
75.3%
Yalobusha
Mississippi
37
18387
201.2
86.2%
Yazoo
Mississippi
46
40091
114.7
49.1%
Beaverhead
Montana
18
6943
259.3
111.1%
Big Horn
Montana
22
10419
211.2
90.4%
Blaine
Montana
31
9566
324.1
138.8%
Broadwater
Montana
17
3451
492.6
211.0%
Carbon
Montana
44
11865
370.8
158.8%
Carter
Montana
21
3280
640.2
274.2%
Cascade
Montana
114
41999
271.4
116.3%
Chouteau
Montana
25
7316
341.7
146.4%
Custer
Montana
30
10422
287.9
123.3%
Daniels
Montana
10
4563
219.2
93.9%
Dawson
Montana
36
8618
417.7
178.9%
Deer Lodge
Montana
41
13627
300.9
128.9%
Fallon
Montana
14
3719
376.4
161.2%
Fergus
Montana
42
14040
299.1
128.1%
Flathead
Montana
81
24271
333.7
143.0%
Gallatin
Montana
58
18269
317.5
136.0%
Garfield
Montana
13
2641
492.2
210.8%
Glacier
Montana
27
9034
298.9
128.0%
Golden Valley
Montana
8
1607
497.8
213.2%
Granite
Montana
11
3401
323.4
138.5%
Hill
Montana
41
13304
308.2
132.0%
Jefferson
Montana
10
4664
214.4
91.8%
Judith Basin
Montana
7
3655
191.5
82.0%
Lake
Montana
35
13490
259.5
111.1%
Lewis And Clark
Montana
56
22131
253.0
108.4%
Liberty
Montana
3
2209
135.8
58.2%
Lincoln
Montana
16
7882
203.0
87.0%
Madison
Montana
11
7294
150.8
64.6%
Mccone
Montana
10
3798
263.3
112.8%
Meagher
Montana
5
2237
223.5
95.7%
Mineral
Montana
6
2135
281.0
120.4%
Missoula
Montana
77
29038
265.2
113.6%
Musselshell
Montana
15
5717
262.4
112.4%
Park
Montana
33
11566
285.3
122.2%
Petroleum
Montana
3
1083
277.0
118.7%
Phillips
Montana
30
7892
380.1
162.8%
Pondera
Montana
17
6716
253.1
108.4%
Powder River
Montana
4
3159
126.6
54.2%
Powell
Montana
13
6152
211.3
90.5%
Prairie
Montana
10
2410
414.9
177.7%
Ravalli
Montana
37
12978
285.1
122.1%
Richland
Montana
25
10209
244.9
104.9%
Roosevelt
Montana
37
9806
377.3
161.6%
Rosebud
Montana
16
6477
247.0
105.8%
Sanders
Montana
13
6926
187.7
80.4%
Sheridan
Montana
17
7814
217.6
93.2%
Silver Bow
Montana
120
53207
225.5
96.6%
St.illwater
Montana
10
5694
175.6
75.2%
Sweet Grass
Montana
8
3719
215.1
92.1%
Teton
Montana
18
6922
260.0
111.4%
Toole
Montana
19
6769
280.7
120.2%
Treasure
Montana
4
1499
266.8
114.3%
Valley
Montana
30
15181
197.6
84.6%
Wheatland
Montana
15
3286
456.5
195.5%
Wibaux
Montana
8
2161
370.2
158.6%
Yellowstone
Montana
99
41182
240.4
103.0%
Yellowstone Np (pt)
Montana
1
43
2325.6
996.2%
Alamance
North Carolina
153
57427
266.4
114.1%
Alexander
North Carolina
48
13454
356.8
152.8%
Alleghany
North Carolina
21
8341
251.8
107.8%
Anson
North Carolina
39
28443
137.1
58.7%
Ashe
North Carolina
53
22664
233.9
100.2%
Avery
North Carolina
42
13561
309.7
132.7%
Beaufort
North Carolina
56
36431
153.7
65.8%
Bertie
North Carolina
34
26201
129.8
55.6%
Bladen
North Carolina
39
27156
143.6
61.5%
Brunswick
North Carolina
25
17125
146.0
62.5%
Buncombe
North Carolina
255
108755
234.5
100.4%
Burke
North Carolina
109
38615
282.3
120.9%
Cabarrus
North Carolina
171
59393
287.9
123.3%
Caldwell
North Carolina
87
35795
243.1
104.1%
Camden
North Carolina
5
5440
91.9
39.4%
Carteret
North Carolina
26
18284
142.2
60.9%
Caswell
North Carolina
23
20032
114.8
49.2%
Catawba
North Carolina
114
51653
220.7
94.5%
Chatham
North Carolina
36
24726
145.6
62.4%
Cherokee
North Carolina
47
18813
249.8
107.0%
Chowan
North Carolina
16
11572
138.3
59.2%
Clay
North Carolina
12
6405
187.4
80.3%
Cleveland
North Carolina
122
58055
210.1
90.0%
Columbus
North Carolina
88
45663
192.7
82.5%
Craven
North Carolina
34
31298
108.6
46.5%
Cumberland
North Carolina
128
59320
215.8
92.4%
Currituck
North Carolina
7
6709
104.3
44.7%
Dare
North Carolina
5
6041
82.8
35.5%
Davidson
North Carolina
121
53377
226.7
97.1%
Davie
North Carolina
37
14909
248.2
106.3%
Duplin
North Carolina
66
39739
166.1
71.1%
Durham
North Carolina
157
80244
195.7
83.8%
Edgecombe
North Carolina
51
49162
103.7
44.4%
Forsyth
North Carolina
265
126475
209.5
89.8%
Franklin
North Carolina
26
30382
85.6
36.7%
Gaston
North Carolina
254
87531
290.2
124.3%
Gates
North Carolina
12
10060
119.3
51.1%
Graham
North Carolina
17
6418
264.9
113.5%
Granville
North Carolina
34
29344
115.9
49.6%
Greene
North Carolina
20
18548
107.8
46.2%
Guilford
North Carolina
355
153916
230.6
98.8%
Halifax
North Carolina
79
56512
139.8
59.9%
Harnett
North Carolina
65
44239
146.9
62.9%
Haywood
North Carolina
100
34804
287.3
123.1%
Henderson
North Carolina
60
26049
230.3
98.7%
Hertford
North Carolina
26
19352
134.4
57.5%
Hoke
North Carolina
14
14937
93.7
40.1%
Hyde
North Carolina
14
7860
178.1
76.3%
Iredell
North Carolina
97
50424
192.4
82.4%
Jackson
North Carolina
55
19366
284.0
121.7%
Johnston
North Carolina
98
63798
153.6
65.8%
Jones
North Carolina
9
10926
82.4
35.3%
Lee
North Carolina
53
18743
282.8
121.1%
Lenoir
North Carolina
68
41211
165.0
70.7%
Lincoln
North Carolina
71
24187
293.5
125.7%
Macon
North Carolina
44
15880
277.1
118.7%
Madison
North Carolina
43
22522
190.9
81.8%
Martin
North Carolina
31
26111
118.7
50.9%
Mcdowell
North Carolina
62
22996
269.6
115.5%
Mecklenburg
North Carolina
363
151826
239.1
102.4%
Mitchell
North Carolina
35
15980
219.0
93.8%
Montgomery
North Carolina
40
16280
245.7
105.2%
Moore
North Carolina
71
30969
229.3
98.2%
Nash
North Carolina
92
55608
165.4
70.9%
New Hanover
North Carolina
94
47935
196.1
84.0%
Northampton
North Carolina
22
28299
77.7
33.3%
Onslow
North Carolina
41
17939
228.6
97.9%
Orange
North Carolina
42
23072
182.0
78.0%
Pamlico
North Carolina
12
9706
123.6
53.0%
Pasquotank
North Carolina
26
20568
126.4
54.1%
Pender
North Carolina
22
17710
124.2
53.2%
Perquimans
North Carolina
13
9773
133.0
57.0%
Person
North Carolina
53
25029
211.8
90.7%
Pitt
North Carolina
80
61244
130.6
56.0%
Polk
North Carolina
34
11874
286.3
122.7%
Randolph
North Carolina
86
44554
193.0
82.7%
Richmond
North Carolina
63
36810
171.1
73.3%
Robeson
North Carolina
141
76860
183.5
78.6%
Rockingham
North Carolina
131
57898
226.3
96.9%
Rowan
North Carolina
146
69206
211.0
90.4%
Rutherford
North Carolina
88
45577
193.1
82.7%
Sampson
North Carolina
56
47440
118.0
50.6%
Scotland
North Carolina
38
23232
163.6
70.1%
St.anly
North Carolina
76
32834
231.5
99.1%
St.okes
North Carolina
39
22656
172.1
73.7%
Surry
North Carolina
113
41783
270.4
115.8%
Swain
North Carolina
43
12177
353.1
151.3%
Transylvania
North Carolina
35
12241
285.9
122.5%
Tyrrell
North Carolina
8
5556
144.0
61.7%
Union
North Carolina
89
39097
227.6
97.5%
Vance
North Carolina
67
29961
223.6
95.8%
Wake
North Carolina
198
109544
180.7
77.4%
Warren
North Carolina
35
23145
151.2
64.8%
Washington
North Carolina
20
12323
162.3
69.5%
Watauga
North Carolina
35
18114
193.2
82.8%
Wayne
North Carolina
82
58328
140.6
60.2%
Wilkes
North Carolina
97
43003
225.6
96.6%
Wilson
North Carolina
87
50219
173.2
74.2%
Yadkin
North Carolina
35
20657
169.4
72.6%
Yancey
North Carolina
29
17202
168.6
72.2%
Adams
North Dakota
8
4664
171.5
73.5%
Barnes
North Dakota
41
17814
230.2
98.6%
Benson
North Dakota
34
12629
269.2
115.3%
Billings
North Dakota
9
2531
355.6
152.3%
Bottineau
North Dakota
32
13253
241.5
103.4%
Bowman
North Dakota
13
3860
336.8
144.3%
Burke
North Dakota
21
7653
274.4
117.5%
Burleigh
North Dakota
47
22736
206.7
88.5%
Cass
North Dakota
147
52849
278.2
119.1%
Cavalier
North Dakota
33
13923
237.0
101.5%
Dickey
North Dakota
25
9696
257.8
110.4%
Divide
North Dakota
15
7086
211.7
90.7%
Dunn
North Dakota
24
8376
286.5
122.7%
Eddy
North Dakota
15
5741
261.3
111.9%
Emmons
North Dakota
24
11699
205.1
87.9%
Foster
North Dakota
15
5824
257.6
110.3%
Golden Valley
North Dakota
11
3498
314.5
134.7%
Grand Forks
North Dakota
95
34518
275.2
117.9%
Grant
North Dakota
13
8264
157.3
67.4%
Griggs
North Dakota
16
5818
275.0
117.8%
Hettinger
North Dakota
21
7457
281.6
120.6%
Kidder
North Dakota
16
6692
239.1
102.4%
La Moure
North Dakota
25
10298
242.8
104.0%
Logan
North Dakota
16
7561
211.6
90.6%
Mchenry
North Dakota
31
14034
220.9
94.6%
Mcintosh
North Dakota
20
8984
222.6
95.4%
Mckenzie
North Dakota
22
8426
261.1
111.8%
Mclean
North Dakota
45
16082
279.8
119.9%
Mercer
North Dakota
9
9611
93.6
40.1%
Morton
North Dakota
43
20184
213.0
91.3%
Mountrail
North Dakota
25
10482
238.5
102.2%
Nelson
North Dakota
24
9129
262.9
112.6%
Oliver
North Dakota
3
3859
77.7
33.3%
Pembina
North Dakota
38
15671
242.5
103.9%
Pierce
North Dakota
19
9208
206.3
88.4%
Ramsey
North Dakota
36
15626
230.4
98.7%
Ransom
North Dakota
28
10061
278.3
119.2%
Renville
North Dakota
15
5533
271.1
116.1%
Richland
North Dakota
41
20519
199.8
85.6%
Rolette
North Dakota
32
12583
254.3
108.9%
Sargent
North Dakota
22
8693
253.1
108.4%
Sheridan
North Dakota
13
6616
196.5
84.2%
Sioux
North Dakota
11
4419
248.9
106.6%
Slope
North Dakota
7
2932
238.7
102.3%
St.ark
North Dakota
39
15414
253.0
108.4%
St.eele
North Dakota
20
6193
322.9
138.3%
St.utsman
North Dakota
57
23495
242.6
103.9%
Towner
North Dakota
17
7200
236.1
101.1%
Traill
North Dakota
37
12300
300.8
128.9%
Walsh
North Dakota
66
20747
318.1
136.3%
Ward
North Dakota
82
31981
256.4
109.8%
Wells
North Dakota
33
11198
294.7
126.2%
Williams
North Dakota
58
16315
355.5
152.3%
Adams
Nebraska
64
24576
260.4
111.5%
Antelope
Nebraska
30
13289
225.8
96.7%
Arthur
Nebraska
1
1045
95.7
41.0%
Banner
Nebraska
0
1403
0.0
0.0%
Blaine
Nebraska
4
1538
260.1
111.4%
Boone
Nebraska
22
12127
181.4
77.7%
Box Butte
Nebraska
10
10736
93.1
39.9%
Boyd
Nebraska
7
6060
115.5
49.5%
Brown
Nebraska
12
5962
201.3
86.2%
Buffalo
Nebraska
48
23655
202.9
86.9%
Burt
Nebraska
33
12546
263.0
112.7%
Butler
Nebraska
27
13106
206.0
88.2%
Cass
Nebraska
37
16992
217.7
93.3%
Cedar
Nebraska
34
15126
224.8
96.3%
Chase
Nebraska
15
5310
282.5
121.0%
Cherry
Nebraska
32
9637
332.1
142.2%
Cheyenne
Nebraska
17
9505
178.9
76.6%
Clay
Nebraska
19
10445
181.9
77.9%
Colfax
Nebraska
31
10627
291.7
125.0%
Cuming
Nebraska
19
13562
140.1
60.0%
Custer
Nebraska
47
22591
208.0
89.1%
Dakota
Nebraska
24
9836
244.0
104.5%
Dawes
Nebraska
26
10128
256.7
110.0%
Dawson
Nebraska
54
17890
301.8
129.3%
Deuel
Nebraska
12
3580
335.2
143.6%
Dixon
Nebraska
18
10413
172.9
74.0%
Dodge
Nebraska
52
23799
218.5
93.6%
Douglas
Nebraska
595
247562
240.3
103.0%
Dundy
Nebraska
10
5122
195.2
83.6%
Fillmore
Nebraska
24
11417
210.2
90.0%
Franklin
Nebraska
19
7740
245.5
105.2%
Frontier
Nebraska
11
6417
171.4
73.4%
Furnas
Nebraska
24
10098
237.7
101.8%
Gage
Nebraska
75
29588
253.5
108.6%
Garden
Nebraska
12
4680
256.4
109.8%
Garfield
Nebraska
15
3444
435.5
186.6%
Gosper
Nebraska
10
3687
271.2
116.2%
Grant
Nebraska
9
1327
678.2
290.5%
Greeley
Nebraska
16
6845
233.7
100.1%
Hall
Nebraska
78
27523
283.4
121.4%
Hamilton
Nebraska
16
9982
160.3
68.7%
Harlan
Nebraska
8
7130
112.2
48.1%
Hayes
Nebraska
6
2958
202.8
86.9%
Hitchcock
Nebraska
16
6404
249.8
107.0%
Holt
Nebraska
48
16552
290.0
124.2%
Hooker
Nebraska
5
1253
399.0
170.9%
Howard
Nebraska
15
8422
178.1
76.3%
Jefferson
Nebraska
38
15532
244.7
104.8%
Johnson
Nebraska
19
8662
219.3
94.0%
Kearney
Nebraska
11
6854
160.5
68.7%
Keith
Nebraska
19
8333
228.0
97.7%
Keya Paha
Nebraska
5
3235
154.6
66.2%
Kimball
Nebraska
9
3913
230.0
98.5%
Knox
Nebraska
32
16478
194.2
83.2%
Lancaster
Nebraska
233
100585
231.6
99.2%
Lincoln
Nebraska
71
25425
279.3
119.6%
Logan
Nebraska
15
1742
861.1
368.8%
Loup
Nebraska
3
1777
168.8
72.3%
Madison
Nebraska
52
24269
214.3
91.8%
Mcpherson
Nebraska
1
1175
85.1
36.5%
Merrick
Nebraska
24
9354
256.6
109.9%
Morrill
Nebraska
21
9436
222.6
95.3%
Nance
Nebraska
11
7653
143.7
61.6%
Nemaha
Nebraska
45
12781
352.1
150.8%
Nuckolls
Nebraska
21
10446
201.0
86.1%
Otoe
Nebraska
39
18994
205.3
88.0%
Pawnee
Nebraska
16
8514
187.9
80.5%
Perkins
Nebraska
5
5197
96.2
41.2%
Phelps
Nebraska
11
8452
130.1
55.7%
Pierce
Nebraska
21
10211
205.7
88.1%
Platte
Nebraska
40
20191
198.1
84.9%
Polk
Nebraska
12
8748
137.2
58.8%
Red Willow
Nebraska
20
11951
167.4
71.7%
Richardson
Nebraska
44
19178
229.4
98.3%
Rock
Nebraska
9
3977
226.3
96.9%
Saline
Nebraska
33
15010
219.9
94.2%
Sarpy
Nebraska
16
10835
147.7
63.3%
Saunders
Nebraska
37
17892
206.8
88.6%
Scotts Bluff
Nebraska
59
33917
174.0
74.5%
Seward
Nebraska
29
14167
204.7
87.7%
Sheridan
Nebraska
22
9869
222.9
95.5%
Sherman
Nebraska
14
7764
180.3
77.2%
Sioux
Nebraska
3
4001
75.0
32.1%
St.anton
Nebraska
12
6887
174.2
74.6%
Thayer
Nebraska
32
12262
261.0
111.8%
Thomas
Nebraska
5
1553
322.0
137.9%
Thurston
Nebraska
22
10243
214.8
92.0%
Valley
Nebraska
15
8163
183.8
78.7%
Washington
Nebraska
25
11578
215.9
92.5%
Wayne
Nebraska
18
9880
182.2
78.0%
Webster
Nebraska
14
8071
173.5
74.3%
Wheeler
Nebraska
2
2170
92.2
39.5%
York
Nebraska
23
14874
154.6
66.2%
Belknap
New Hampshire
50
24328
205.5
88.0%
Carroll
New Hampshire
34
15589
218.1
93.4%
Cheshire
New Hampshire
92
34953
263.2
112.7%
Coos
New Hampshire
99
39274
252.1
108.0%
Grafton
New Hampshire
124
44645
277.7
119.0%
Hillsborough
New Hampshire
360
144888
248.5
106.4%
Merrimack
New Hampshire
113
60710
186.1
79.7%
Rockingham
New Hampshire
134
58142
230.5
98.7%
St.rafford
New Hampshire
108
43553
248.0
106.2%
Sullivan
New Hampshire
80
25442
314.4
134.7%
Atlantic
New Jersey
236
124066
190.2
81.5%
Bergen
New Jersey
1054
409646
257.3
110.2%
Burlington
New Jersey
243
97013
250.5
107.3%
Camden
New Jersey
608
255727
237.8
101.8%
Cape May
New Jersey
76
28919
262.8
112.6%
Cumberland
New Jersey
152
73184
207.7
89.0%
Essex
New Jersey
2000
837340
238.9
102.3%
Gloucester
New Jersey
183
72219
253.4
108.5%
Hudson
New Jersey
1602
652040
245.7
105.2%
Hunterdon
New Jersey
77
36766
209.4
89.7%
Mercer
New Jersey
517
197318
262.0
112.2%
Middlesex
New Jersey
673
217077
310.0
132.8%
Monmouth
New Jersey
355
161238
220.2
94.3%
Morris
New Jersey
302
125732
240.2
102.9%
Ocean
New Jersey
85
37706
225.4
96.6%
Passaic
New Jersey
759
309353
245.4
105.1%
Salem
New Jersey
91
42274
215.3
92.2%
Somerset
New Jersey
182
74390
244.7
104.8%
Sussex
New Jersey
87
29632
293.6
125.8%
Union
New Jersey
851
328344
259.2
111.0%
Warren
New Jersey
120
50181
239.1
102.4%
Bernalillo
New Mexico
354
69391
510.2
218.5%
Catron
New Mexico
14
4881
286.8
122.9%
Chaves
New Mexico
93
23980
387.8
166.1%
Colfax
New Mexico
61
18718
325.9
139.6%
Curry
New Mexico
84
18159
462.6
198.1%
De Baca
New Mexico
18
3725
483.2
207.0%
Dona Ana
New Mexico
98
30411
322.3
138.0%
Eddy
New Mexico
116
24311
477.2
204.4%
Grant
New Mexico
108
20050
538.7
230.7%
Guadalupe
New Mexico
29
8646
335.4
143.7%
Harding
New Mexico
13
4374
297.2
127.3%
Hidalgo
New Mexico
14
4821
290.4
124.4%
Lea
New Mexico
65
21154
307.3
131.6%
Lincoln
New Mexico
34
8557
397.3
170.2%
Luna
New Mexico
58
6457
898.2
384.8%
Mckinley
New Mexico
103
23641
435.7
186.6%
Mora
New Mexico
41
10981
373.4
159.9%
Otero
New Mexico
37
10522
351.6
150.6%
Quay
New Mexico
24
12111
198.2
84.9%
Rio Arriba
New Mexico
60
25352
236.7
101.4%
Roosevelt
New Mexico
45
14549
309.3
132.5%
Sandoval
New Mexico
41
13898
295.0
126.4%
San Juan
New Mexico
45
17115
262.9
112.6%
San Miguel
New Mexico
71
27910
254.4
109.0%
Santa Fe
New Mexico
117
30826
379.5
162.6%
Sierra
New Mexico
25
6962
359.1
153.8%
Socorro
New Mexico
36
11422
315.2
135.0%
Taos
New Mexico
69
18528
372.4
159.5%
Torrance
New Mexico
33
11026
299.3
128.2%
Union
New Mexico
31
9095
340.8
146.0%
Valencia
New Mexico
82
20245
405.0
173.5%
Churchill
Nevada
20
5317
376.2
161.1%
Clark
Nevada
69
16414
420.4
180.1%
Douglas
Nevada
7
2056
340.5
145.8%
Elko
Nevada
32
10912
293.3
125.6%
Esmeralda
Nevada
0
1554
0.0
0.0%
Eureka
Nevada
4
1361
293.9
125.9%
Humboldt
Nevada
12
4743
253.0
108.4%
Lander
Nevada
6
1745
343.8
147.3%
Lincoln
Nevada
12
4130
290.6
124.5%
Lyon
Nevada
11
4076
269.9
115.6%
Mineral
Nevada
16
2342
683.2
292.6%
Nye
Nevada
11
3606
305.0
130.7%
Pershing
Nevada
8
2713
294.9
126.3%
St.orey
Nevada
3
1216
246.7
105.7%
Washoe
Nevada
88
32476
271.0
116.1%
White Pine
Nevada
25
12377
202.0
86.5%
Albany
New York
556
221315
251.2
107.6%
Allegany
New York
125
39681
315.0
134.9%
Bronx
New York
2014
1394711
144.4
61.9%
Broome
New York
438
165749
264.3
113.2%
Cattaraugus
New York
191
72652
262.9
112.6%
Cayuga
New York
172
65508
262.6
112.5%
Chautauqua
New York
345
123580
279.2
119.6%
Chemung
New York
194
73718
263.2
112.7%
Chenango
New York
103
36454
282.5
121.0%
Clinton
New York
118
54006
218.5
93.6%
Columbia
New York
96
41464
231.5
99.2%
Cortland
New York
73
33668
216.8
92.9%
Delaware
New York
110
40989
268.4
115.0%
Dutchess
New York
314
120542
260.5
111.6%
Erie
New York
2077
798377
260.2
111.4%
Essex
New York
114
34178
333.5
142.9%
Franklin
New York
104
44286
234.8
100.6%
Fulton
New York
108
48597
222.2
95.2%
Genesee
New York
113
44481
254.0
108.8%
Greene
New York
77
27926
275.7
118.1%
Hamilton
New York
22
4188
525.3
225.0%
Herkimer
New York
165
59527
277.2
118.7%
Jefferson
New York
220
84003
261.9
112.2%
Kings
New York
5840
2698285
216.4
92.7%
Lewis
New York
61
22815
267.4
114.5%
Livingston
New York
71
38510
184.4
79.0%
Madison
New York
103
39598
260.1
111.4%
Monroe
New York
1051
438230
239.8
102.7%
Montgomery
New York
175
59142
295.9
126.7%
Nassau
New York
855
406748
210.2
90.0%
New York
New York
4910
1889924
259.8
111.3%
Niagara
New York
515
160110
321.7
137.8%
Oneida
New York
534
203636
262.2
112.3%
Onondaga
New York
787
295108
266.7
114.2%
Ontario
New York
129
55307
233.2
99.9%
Orange
New York
305
140113
217.7
93.2%
Orleans
New York
100
27760
360.2
154.3%
Oswego
New York
192
71275
269.4
115.4%
Otsego
New York
110
46082
238.7
102.2%
Putnam
New York
44
16555
265.8
113.8%
Queens
New York
2997
1297634
231.0
98.9%
Rensselaer
New York
282
121834
231.5
99.1%
Richmond
New York
346
174441
198.3
85.0%
Rockland
New York
158
74261
212.8
91.1%
Saratoga
New York
178
65606
271.3
116.2%
Schenectady
New York
278
122494
226.9
97.2%
Schoharie
New York
35
20812
168.2
72.0%
Schuyler
New York
37
12979
285.1
122.1%
Seneca
New York
50
25732
194.3
83.2%
St.euben
New York
232
84927
273.2
117.0%
St Lawrence
New York
246
91098
270.0
115.7%
Suffolk
New York
325
197355
164.7
70.5%
Sullivan
New York
91
37901
240.1
102.8%
Tioga
New York
63
27072
232.7
99.7%
Tompkins
New York
97
42340
229.1
98.1%
Ulster
New York
197
87017
226.4
97.0%
Warren
New York
96
36035
266.4
114.1%
Washington
New York
113
46726
241.8
103.6%
Wayne
New York
140
52747
265.4
113.7%
Westchester
New York
1295
573558
225.8
96.7%
Wyoming
New York
60
31394
191.1
81.9%
Yates
New York
49
16381
299.1
128.1%
Adams
Ohio
58
21705
267.2
114.5%
Allen
Ohio
171
73303
233.3
99.9%
Ashland
Ohio
75
29785
251.8
107.9%
Ashtabula
Ohio
160
68674
233.0
99.8%
Athens
Ohio
129
46166
279.4
119.7%
Auglaize
Ohio
72
28037
256.8
110.0%
Belmont
Ohio
252
95614
263.6
112.9%
Brown
Ohio
43
21638
198.7
85.1%
Butler
Ohio
307
120249
255.3
109.4%
Carroll
Ohio
41
17449
235.0
100.6%
Champaign
Ohio
47
25258
186.1
79.7%
Clark
Ohio
218
95647
227.9
97.6%
Clermont
Ohio
71
34109
208.2
89.2%
Clinton
Ohio
48
22574
212.6
91.1%
Columbiana
Ohio
247
90121
274.1
117.4%
Coshocton
Ohio
68
30594
222.3
95.2%
Crawford
Ohio
74
35571
208.0
89.1%
Cuyahoga
Ohio
3004
1217250
246.8
105.7%
Darke
Ohio
91
38831
234.3
100.4%
Defiance
Ohio
52
24367
213.4
91.4%
Delaware
Ohio
53
26780
197.9
84.8%
Erie
Ohio
89
43201
206.0
88.2%
Fairfield
Ohio
96
48490
198.0
84.8%
Fayette
Ohio
60
21385
280.6
120.2%
Franklin
Ohio
890
388712
229.0
98.1%
Fulton
Ohio
54
23626
228.6
97.9%
Gallia
Ohio
61
24930
244.7
104.8%
Geauga
Ohio
45
19430
231.6
99.2%
Greene
Ohio
77
35863
214.7
92.0%
Guernsey
Ohio
82
38822
211.2
90.5%
Hamilton
Ohio
1357
621987
218.2
93.5%
Hancock
Ohio
94
40793
230.4
98.7%
Hardin
Ohio
77
27061
284.5
121.9%
Harrison
Ohio
57
20313
280.6
120.2%
Henry
Ohio
66
22756
290.0
124.2%
Highland
Ohio
59
27099
217.7
93.3%
Hocking
Ohio
43
21504
200.0
85.7%
Holmes
Ohio
34
17876
190.2
81.5%
Huron
Ohio
97
34800
278.7
119.4%
Jackson
Ohio
61
27004
225.9
96.8%
Jefferson
Ohio
270
98129
275.1
117.9%
Knox
Ohio
77
31024
248.2
106.3%
Lake
Ohio
131
50020
261.9
112.2%
Lawrence
Ohio
89
46705
190.6
81.6%
Licking
Ohio
122
62279
195.9
83.9%
Logan
Ohio
52
29624
175.5
75.2%
Lorain
Ohio
321
112390
285.6
122.3%
Lucas
Ohio
763
344333
221.6
94.9%
Madison
Ohio
54
21811
247.6
106.1%
Mahoning
Ohio
654
240251
272.2
116.6%
Marion
Ohio
109
44898
242.8
104.0%
Medina
Ohio
64
33034
193.7
83.0%
Meigs
Ohio
70
24104
290.4
124.4%
Mercer
Ohio
60
26256
228.5
97.9%
Miami
Ohio
144
52632
273.6
117.2%
Monroe
Ohio
48
18641
257.5
110.3%
Montgomery
Ohio
688
295480
232.8
99.7%
Morgan
Ohio
25
14227
175.7
75.3%
Morrow
Ohio
25
15646
159.8
68.4%
Muskingum
Ohio
166
69795
237.8
101.9%
Noble
Ohio
26
14587
178.2
76.3%
Ottawa
Ohio
103
24360
422.8
181.1%
Paulding
Ohio
32
15527
206.1
88.3%
Perry
Ohio
79
31087
254.1
108.9%
Pickaway
Ohio
46
27889
164.9
70.7%
Pike
Ohio
36
16113
223.4
95.7%
Portage
Ohio
139
46660
297.9
127.6%
Preble
Ohio
77
23329
330.1
141.4%
Putnam
Ohio
50
25016
199.9
85.6%
Richland
Ohio
168
73853
227.5
97.4%
Ross
Ohio
111
52147
212.9
91.2%
Sandusky
Ohio
91
41014
221.9
95.0%
Scioto
Ohio
183
86565
211.4
90.6%
Seneca
Ohio
105
48499
216.5
92.7%
Shelby
Ohio
74
26071
283.8
121.6%
St.ark
Ohio
673
234887
286.5
122.7%
Summit
Ohio
940
339405
277.0
118.6%
Trumbull
Ohio
397
132315
300.0
128.5%
Tuscarawas
Ohio
168
68816
244.1
104.6%
Union
Ohio
43
20012
214.9
92.0%
Van Wert
Ohio
71
26759
265.3
113.7%
Vinton
Ohio
26
11573
224.7
96.2%
Warren
Ohio
75
29894
250.9
107.5%
Washington
Ohio
114
43537
261.8
112.2%
Wayne
Ohio
97
50520
192.0
82.2%
Williams
Ohio
45
25510
176.4
75.6%
Wood
Ohio
115
51796
222.0
95.1%
Wyandot
Ohio
42
19218
218.5
93.6%
Adair
Oklahoma
46
15755
292.0
125.1%
Alfalfa
Oklahoma
30
14129
212.3
91.0%
Atoka
Oklahoma
41
18702
219.2
93.9%
Beaver
Oklahoma
17
8648
196.6
84.2%
Beckham
Oklahoma
55
22169
248.1
106.3%
Blaine
Oklahoma
39
18543
210.3
90.1%
Bryan
Oklahoma
83
38138
217.6
93.2%
Caddo
Oklahoma
89
41567
214.1
91.7%
Canadian
Oklahoma
48
27329
175.6
75.2%
Carter
Oklahoma
85
43292
196.3
84.1%
Cherokee
Oklahoma
63
21030
299.6
128.3%
Choctaw
Oklahoma
58
28358
204.5
87.6%
Cimarron
Oklahoma
15
3654
410.5
175.8%
Cleveland
Oklahoma
75
27728
270.5
115.9%
Coal
Oklahoma
16
12811
124.9
53.5%
Comanche
Oklahoma
93
38988
238.5
102.2%
Cotton
Oklahoma
32
12884
248.4
106.4%
Craig
Oklahoma
50
21083
237.2
101.6%
Creek
Oklahoma
118
55503
212.6
91.1%
Custer
Oklahoma
60
23068
260.1
111.4%
Delaware
Oklahoma
25
18592
134.5
57.6%
Dewey
Oklahoma
30
11981
250.4
107.3%
Ellis
Oklahoma
28
8466
330.7
141.7%
Garfield
Oklahoma
119
45484
261.6
112.1%
Garvin
Oklahoma
74
31150
237.6
101.8%
Grady
Oklahoma
79
41116
192.1
82.3%
Grant
Oklahoma
34
13128
259.0
110.9%
Greer
Oklahoma
36
14550
247.4
106.0%
Harmon
Oklahoma
30
10019
299.4
128.3%
Harper
Oklahoma
16
6454
247.9
106.2%
Haskell
Oklahoma
43
17324
248.2
106.3%
Hughes
Oklahoma
71
29189
243.2
104.2%
Jackson
Oklahoma
64
22708
281.8
120.7%
Jefferson
Oklahoma
32
15107
211.8
90.7%
Johnston
Oklahoma
31
15960
194.2
83.2%
Kay
Oklahoma
131
47084
278.2
119.2%
Kingfisher
Oklahoma
20
15617
128.1
54.9%
Kiowa
Oklahoma
44
22817
192.8
82.6%
Latimer
Oklahoma
31
12380
250.4
107.3%
Le Flore
Oklahoma
105
45866
228.9
98.1%
Lincoln
Oklahoma
69
29529
233.7
100.1%
Logan
Oklahoma
49
25245
194.1
83.1%
Love
Oklahoma
21
11433
183.7
78.7%
Major
Oklahoma
25
11946
209.3
89.6%
Marshall
Oklahoma
24
12384
193.8
83.0%
Mayes
Oklahoma
54
21668
249.2
106.8%
Mcclain
Oklahoma
43
19205
223.9
95.9%
Mccurtain
Oklahoma
94
41318
227.5
97.5%
Mcintosh
Oklahoma
51
24097
211.6
90.7%
Murray
Oklahoma
21
13841
151.7
65.0%
Muskogee
Oklahoma
144
65914
218.5
93.6%
Noble
Oklahoma
42
14826
283.3
121.3%
Nowata
Oklahoma
41
15774
259.9
111.3%
Okfuskee
Oklahoma
58
26279
220.7
94.5%
Oklahoma
Oklahoma
580
244159
237.6
101.8%
Okmulgee
Oklahoma
128
50101
255.5
109.4%
Osage
Oklahoma
106
41502
255.4
109.4%
Ottawa
Oklahoma
77
35849
214.8
92.0%
Pawnee
Oklahoma
55
17395
316.2
135.4%
Payne
Oklahoma
107
36057
296.8
127.1%
Pittsburg
Oklahoma
107
48985
218.4
93.6%
Pontotoc
Oklahoma
103
39792
258.8
110.9%
Pottawatomie
Oklahoma
107
54377
196.8
84.3%
Pushmataha
Oklahoma
55
19466
282.5
121.0%
Roger Mills
Oklahoma
19
10736
177.0
75.8%
Rogers
Oklahoma
49
21078
232.5
99.6%
Seminole
Oklahoma
113
61201
184.6
79.1%
Sequoyah
Oklahoma
49
23138
211.8
90.7%
St.ephens
Oklahoma
63
31090
202.6
86.8%
Texas
Oklahoma
26
9896
262.7
112.5%
Tillman
Oklahoma
34
20754
163.8
70.2%
Tulsa
Oklahoma
511
193363
264.3
113.2%
Wagoner
Oklahoma
45
21642
207.9
89.1%
Washington
Oklahoma
91
30559
297.8
127.6%
Washita
Oklahoma
41
22279
184.0
78.8%
Woods
Oklahoma
43
14915
288.3
123.5%
Woodward
Oklahoma
36
16270
221.3
94.8%
Baker
Oregon
42
18297
229.5
98.3%
Benton
Oregon
55
18629
295.2
126.5%
Clackamas
Oregon
111
57130
194.3
83.2%
Clatsop
Oregon
45
24697
182.2
78.0%
Columbia
Oregon
50
20971
238.4
102.1%
Coos
Oregon
75
32466
231.0
99.0%
Crook
Oregon
14
5533
253.0
108.4%
Curry
Oregon
12
4301
279.0
119.5%
Deschutes
Oregon
49
18631
263.0
112.7%
Douglas
Oregon
67
25728
260.4
111.5%
Gilliam
Oregon
7
2844
246.1
105.4%
Grant
Oregon
14
6380
219.4
94.0%
Harney
Oregon
11
5374
204.7
87.7%
Hood River
Oregon
21
11580
181.3
77.7%
Jackson
Oregon
116
36213
320.3
137.2%
Jefferson
Oregon
11
2042
538.7
230.7%
Josephine
Oregon
38
16301
233.1
99.9%
Klamath
Oregon
113
40497
279.0
119.5%
Lake
Oregon
21
6293
333.7
142.9%
Lane
Oregon
177
69096
256.2
109.7%
Lincoln
Oregon
28
14549
192.5
82.4%
Linn
Oregon
83
30485
272.3
116.6%
Malheur
Oregon
45
19767
227.7
97.5%
Marion
Oregon
163
75246
216.6
92.8%
Morrow
Oregon
13
4337
299.7
128.4%
Multnomah
Oregon
965
355099
271.8
116.4%
Polk
Oregon
37
19989
185.1
79.3%
Sherman
Oregon
13
2321
560.1
239.9%
Tillamook
Oregon
49
12263
399.6
171.2%
Umatilla
Oregon
86
26030
330.4
141.5%
Union
Oregon
37
17399
212.7
91.1%
Wallowa
Oregon
19
7623
249.2
106.8%
Wasco
Oregon
22
13069
168.3
72.1%
Washington
Oregon
92
39194
234.7
100.5%
Wheeler
Oregon
13
2974
437.1
187.2%
Yamhill
Oregon
72
26336
273.4
117.1%
Adams
Pennsylvania
110
39435
278.9
119.5%
Allegheny
Pennsylvania
3982
1411539
282.1
120.8%
Armstrong
Pennsylvania
264
81087
325.6
139.5%
Beaver
Pennsylvania
479
156754
305.6
130.9%
Bedford
Pennsylvania
109
40809
267.1
114.4%
Berks
Pennsylvania
619
241884
255.9
109.6%
Blair
Pennsylvania
453
140358
322.7
138.2%
Bradford
Pennsylvania
118
50615
233.1
99.9%
Bucks
Pennsylvania
264
107715
245.1
105.0%
Butler
Pennsylvania
228
87590
260.3
111.5%
Cambria
Pennsylvania
696
213459
326.1
139.7%
Cameron
Pennsylvania
26
6852
379.5
162.5%
Carbon
Pennsylvania
215
61735
348.3
149.2%
Centre
Pennsylvania
136
52608
258.5
110.7%
Chester
Pennsylvania
314
135626
231.5
99.2%
Clarion
Pennsylvania
112
38410
291.6
124.9%
Clearfield
Pennsylvania
263
92094
285.6
122.3%
Clinton
Pennsylvania
115
34557
332.8
142.5%
Columbia
Pennsylvania
175
51413
340.4
145.8%
Crawford
Pennsylvania
166
71644
231.7
99.2%
Cumberland
Pennsylvania
199
74806
266.0
113.9%
Dauphin
Pennsylvania
447
177410
252.0
107.9%
Delaware
Pennsylvania
754
310756
242.6
103.9%
Elk
Pennsylvania
103
34443
299.0
128.1%
Erie
Pennsylvania
514
180889
284.2
121.7%
Fayette
Pennsylvania
639
200999
317.9
136.2%
Forest
Pennsylvania
17
5791
293.6
125.7%
Franklin
Pennsylvania
184
69378
265.2
113.6%
Fulton
Pennsylvania
27
10673
253.0
108.4%
Greene
Pennsylvania
123
44671
275.3
117.9%
Huntingdon
Pennsylvania
129
41836
308.3
132.1%
Indiana
Pennsylvania
262
79854
328.1
140.5%
Jefferson
Pennsylvania
157
54090
290.3
124.3%
Juniata
Pennsylvania
39
15373
253.7
108.7%
Lackawanna
Pennsylvania
846
301243
280.8
120.3%
Lancaster
Pennsylvania
453
212504
213.2
91.3%
Lawrence
Pennsylvania
280
96877
289.0
123.8%
Lebanon
Pennsylvania
204
72641
280.8
120.3%
Lehigh
Pennsylvania
391
177533
220.2
94.3%
Luzerne
Pennsylvania
1216
441518
275.4
118.0%
Lycoming
Pennsylvania
252
93633
269.1
115.3%
Mckean
Pennsylvania
164
56673
289.4
124.0%
Mercer
Pennsylvania
239
101039
236.5
101.3%
Mifflin
Pennsylvania
97
42993
225.6
96.6%
Monroe
Pennsylvania
81
29802
271.8
116.4%
Montgomery
Pennsylvania
654
289247
226.1
96.9%
Montour
Pennsylvania
43
15466
278.0
119.1%
Northampton
Pennsylvania
474
168959
280.5
120.2%
Northumberland
Pennsylvania
407
126887
320.8
137.4%
Perry
Pennsylvania
56
23213
241.2
103.3%
Philadelphia
Pennsylvania
4392
1931334
227.4
97.4%
Pike
Pennsylvania
23
7452
308.6
132.2%
Potter
Pennsylvania
33
18201
181.3
77.7%
Schuylkill
Pennsylvania
680
228331
297.8
127.6%
Snyder
Pennsylvania
50
20208
247.4
106.0%
Somerset
Pennsylvania
281
84957
330.8
141.7%
Sullivan
Pennsylvania
27
7504
359.8
154.1%
Susquehanna
Pennsylvania
88
33893
259.6
111.2%
Tioga
Pennsylvania
103
35004
294.3
126.0%
Union
Pennsylvania
41
20247
202.5
86.7%
Venango
Pennsylvania
143
63958
223.6
95.8%
Warren
Pennsylvania
123
42789
287.5
123.1%
Washington
Pennsylvania
649
210852
307.8
131.8%
Wayne
Pennsylvania
81
29934
270.6
115.9%
Westmoreland
Pennsylvania
940
303411
309.8
132.7%
Wyoming
Pennsylvania
36
16702
215.5
92.3%
York
Pennsylvania
396
178022
222.4
95.3%
Bristol
Rhode Island
59
25548
230.9
98.9%
Kent
Rhode Island
160
58311
274.4
117.5%
Newport
Rhode Island
90
46696
192.7
82.6%
Providence
Rhode Island
1258
550298
228.6
97.9%
Washington
Rhode Island
76
32493
233.9
100.2%
Abbeville
South Carolina
47
22931
205.0
87.8%
Aiken
South Carolina
67
49916
134.2
57.5%
Allendale
South Carolina
18
13040
138.0
59.1%
Anderson
South Carolina
181
88712
204.0
87.4%
Bamberg
South Carolina
18
18643
96.6
41.4%
Barnwell
South Carolina
19
20138
94.3
40.4%
Beaufort
South Carolina
31
22037
140.7
60.3%
Berkeley
South Carolina
28
27128
103.2
44.2%
Calhoun
South Carolina
16
16229
98.6
42.2%
Charleston
South Carolina
166
121105
137.1
58.7%
Cherokee
South Carolina
72
33290
216.3
92.6%
Chester
South Carolina
50
32579
153.5
65.7%
Chesterfield
South Carolina
59
35963
164.1
70.3%
Clarendon
South Carolina
45
31500
142.9
61.2%
Colleton
South Carolina
46
26268
175.1
75.0%
Darlington
South Carolina
77
45198
170.4
73.0%
Dillon
South Carolina
43
29625
145.1
62.2%
Dorchester
South Carolina
28
19928
140.5
60.2%
Edgefield
South Carolina
19
17894
106.2
45.5%
Fairfield
South Carolina
36
24187
148.8
63.8%
Florence
South Carolina
116
70582
164.3
70.4%
Georgetown
South Carolina
29
26352
110.0
47.1%
Greenville
South Carolina
324
136580
237.2
101.6%
Greenwood
South Carolina
90
40083
224.5
96.2%
Hampton
South Carolina
26
17465
148.9
63.8%
Horry
South Carolina
70
51951
134.7
57.7%
Jasper
South Carolina
11
11011
99.9
42.8%
Kershaw
South Carolina
69
32913
209.6
89.8%
Lancaster
South Carolina
64
33542
190.8
81.7%
Laurens
South Carolina
100
44185
226.3
96.9%
Lee
South Carolina
22
24908
88.3
37.8%
Lexington
South Carolina
76
35994
211.1
90.4%
Marion
South Carolina
58
30107
192.6
82.5%
Marlboro
South Carolina
49
33281
147.2
63.1%
Mccormick
South Carolina
18
10367
173.6
74.4%
Newberry
South Carolina
65
33577
193.6
82.9%
Oconee
South Carolina
104
36512
284.8
122.0%
Orangeburg
South Carolina
67
63707
105.2
45.0%
Pickens
South Carolina
97
37111
261.4
112.0%
Richland
South Carolina
199
104843
189.8
81.3%
Saluda
South Carolina
27
17192
157.0
67.3%
Spartanburg
South Carolina
316
127733
247.4
106.0%
Sumter
South Carolina
71
52463
135.3
58.0%
Union
South Carolina
72
31360
229.6
98.3%
Williamsburg
South Carolina
51
41011
124.4
53.3%
York
South Carolina
115
58663
196.0
84.0%
Armstrong
South Dakota
1
42
2381.0
1019.9%
Aurora
South Dakota
8
5387
148.5
63.6%
Beadle
South Dakota
50
19648
254.5
109.0%
Bennett
South Dakota
14
3983
351.5
150.6%
Bon Homme
South Dakota
21
10241
205.1
87.8%
Brookings
South Dakota
50
16560
301.9
129.3%
Brown
South Dakota
55
29676
185.3
79.4%
Brule
South Dakota
12
6195
193.7
83.0%
Buffalo
South Dakota
4
1853
215.9
92.5%
Butte
South Dakota
21
8004
262.4
112.4%
Campbell
South Dakota
7
5033
139.1
59.6%
Charles Mix
South Dakota
19
13449
141.3
60.5%
Clark
South Dakota
14
8955
156.3
67.0%
Clay
South Dakota
16
9592
166.8
71.5%
Codington
South Dakota
36
17014
211.6
90.6%
Corson
South Dakota
16
6755
236.9
101.5%
Custer
South Dakota
21
6023
348.7
149.3%
Davison
South Dakota
35
15336
228.2
97.8%
Day
South Dakota
37
13565
272.8
116.8%
Deuel
South Dakota
15
8450
177.5
76.0%
Dewey
South Dakota
16
5709
280.3
120.0%
Douglas
South Dakota
15
6348
236.3
101.2%
Edmunds
South Dakota
19
7814
243.2
104.2%
Fall River
South Dakota
28
8089
346.1
148.3%
Faulk
South Dakota
13
5168
251.5
107.8%
Grant
South Dakota
17
10552
161.1
69.0%
Gregory
South Dakota
19
9554
198.9
85.2%
Haakon
South Dakota
6
3515
170.7
73.1%
Hamlin
South Dakota
13
7562
171.9
73.6%
Hand
South Dakota
19
7166
265.1
113.6%
Hanson
South Dakota
10
5400
185.2
79.3%
Harding
South Dakota
8
3010
265.8
113.8%
Hughes
South Dakota
10
6624
151.0
64.7%
Hutchinson
South Dakota
26
12668
205.2
87.9%
Hyde
South Dakota
7
3113
224.9
96.3%
Jackson
South Dakota
3
1955
153.5
65.7%
Jerauld
South Dakota
14
4752
294.6
126.2%
Jones
South Dakota
10
2509
398.6
170.7%
Kingsbury
South Dakota
28
10831
258.5
110.7%
Lake
South Dakota
39
12412
314.2
134.6%
Lawrence
South Dakota
46
19093
240.9
103.2%
Lincoln
South Dakota
15
13171
113.9
48.8%
Lyman
South Dakota
10
5045
198.2
84.9%
Marshall
South Dakota
22
8880
247.7
106.1%
Mccook
South Dakota
20
9793
204.2
87.5%
Mcpherson
South Dakota
22
8353
263.4
112.8%
Meade
South Dakota
26
9735
267.1
114.4%
Mellette
South Dakota
8
4107
194.8
83.4%
Miner
South Dakota
11
6836
160.9
68.9%
Minnehaha
South Dakota
124
57697
214.9
92.1%
Moody
South Dakota
16
9341
171.3
73.4%
Pennington
South Dakota
62
23799
260.5
111.6%
Perkins
South Dakota
12
6585
182.2
78.1%
Potter
South Dakota
14
4614
303.4
130.0%
Roberts
South Dakota
25
15887
157.4
67.4%
Sanborn
South Dakota
12
5754
208.6
89.3%
Shannon
South Dakota
15
5366
279.5
119.7%
Spink
South Dakota
20
12527
159.7
68.4%
St.anley
South Dakota
3
1959
153.1
65.6%
Sully
South Dakota
6
2668
224.9
96.3%
Todd
South Dakota
15
5714
262.5
112.4%
Tripp
South Dakota
34
9937
342.2
146.6%
Turner
South Dakota
27
13270
203.5
87.2%
Union
South Dakota
22
11675
188.4
80.7%
Walworth
South Dakota
16
7274
220.0
94.2%
Washabaugh (ext)
South Dakota
3
1980
151.5
64.9%
Washington
South Dakota
5
1789
279.5
119.7%
Yankton
South Dakota
27
16725
161.4
69.2%
Ziebach
South Dakota
7
2875
243.5
104.3%
Anderson
Tennessee
54
26504
203.7
87.3%
Bedford
Tennessee
45
23151
194.4
83.3%
Benton
Tennessee
32
11976
267.2
114.5%
Bledsoe
Tennessee
23
8358
275.2
117.9%
Blount
Tennessee
114
41116
277.3
118.8%
Bradley
Tennessee
74
28498
259.7
111.2%
Campbell
Tennessee
104
31131
334.1
143.1%
Cannon
Tennessee
20
9880
202.4
86.7%
Carroll
Tennessee
54
25978
207.9
89.0%
Carter
Tennessee
89
35127
253.4
108.5%
Cheatham
Tennessee
35
9928
352.5
151.0%
Chester
Tennessee
22
11124
197.8
84.7%
Claiborne
Tennessee
59
24657
239.3
102.5%
Clay
Tennessee
21
10904
192.6
82.5%
Cocke
Tennessee
46
24083
191.0
81.8%
Coffee
Tennessee
48
18959
253.2
108.4%
Crockett
Tennessee
33
17330
190.4
81.6%
Cumberland
Tennessee
49
15592
314.3
134.6%
Davidson
Tennessee
534
257267
207.6
88.9%
Decatur
Tennessee
23
10261
224.1
96.0%
Dekalb
Tennessee
22
14588
150.8
64.6%
Dickson
Tennessee
44
19718
223.1
95.6%
Dyer
Tennessee
74
34920
211.9
90.8%
Fayette
Tennessee
27
30322
89.0
38.1%
Fentress
Tennessee
55
14262
385.6
165.2%
Franklin
Tennessee
58
23892
242.8
104.0%
Gibson
Tennessee
94
44835
209.7
89.8%
Giles
Tennessee
62
29240
212.0
90.8%
Grainger
Tennessee
29
14356
202.0
86.5%
Greene
Tennessee
98
39405
248.7
106.5%
Grundy
Tennessee
25
11552
216.4
92.7%
Hamblen
Tennessee
53
18611
284.8
122.0%
Hamilton
Tennessee
410
180478
227.2
97.3%
Hancock
Tennessee
14
11231
124.7
53.4%
Hardeman
Tennessee
36
23590
152.6
65.4%
Hardin
Tennessee
55
17806
308.9
132.3%
Hawkins
Tennessee
80
28523
280.5
120.1%
Haywood
Tennessee
25
27699
90.3
38.7%
Henderson
Tennessee
41
19220
213.3
91.4%
Henry
Tennessee
66
25877
255.1
109.3%
Hickman
Tennessee
41
14873
275.7
118.1%
Houston
Tennessee
11
6432
171.0
73.3%
Humphreys
Tennessee
32
12421
257.6
110.4%
Jackson
Tennessee
36
15082
238.7
102.2%
Jefferson
Tennessee
79
18621
424.3
181.7%
Johnson
Tennessee
34
12998
261.6
112.0%
Knox
Tennessee
454
178468
254.4
109.0%
Lake
Tennessee
26
11235
231.4
99.1%
Lauderdale
Tennessee
43
24461
175.8
75.3%
Lawrence
Tennessee
64
28726
222.8
95.4%
Lewis
Tennessee
18
5849
307.7
131.8%
Lincoln
Tennessee
52
27214
191.1
81.8%
Loudon
Tennessee
63
19838
317.6
136.0%
Macon
Tennessee
36
14904
241.5
103.5%
Madison
Tennessee
91
54115
168.2
72.0%
Marion
Tennessee
43
19140
224.7
96.2%
Marshall
Tennessee
26
16030
162.2
69.5%
Maury
Tennessee
82
40357
203.2
87.0%
Mcminn
Tennessee
79
30781
256.7
109.9%
Mcnairy
Tennessee
46
20424
225.2
96.5%
Meigs
Tennessee
13
6393
203.3
87.1%
Monroe
Tennessee
67
24275
276.0
118.2%
Montgomery
Tennessee
61
33346
182.9
78.4%
Moore
Tennessee
8
4093
195.5
83.7%
Morgan
Tennessee
44
15242
288.7
123.7%
Obion
Tennessee
54
30978
174.3
74.7%
Overton
Tennessee
45
18883
238.3
102.1%
Perry
Tennessee
15
7535
199.1
85.3%
Pickett
Tennessee
16
6213
257.5
110.3%
Polk
Tennessee
38
15473
245.6
105.2%
Putnam
Tennessee
68
26250
259.0
111.0%
Rhea
Tennessee
49
16353
299.6
128.3%
Roane
Tennessee
92
27795
331.0
141.8%
Robertson
Tennessee
37
29046
127.4
54.6%
Rutherford
Tennessee
53
33604
157.7
67.6%
Scott
Tennessee
60
15966
375.8
161.0%
Sequatchie
Tennessee
14
5038
277.9
119.0%
Sevier
Tennessee
69
23291
296.3
126.9%
Shelby
Tennessee
662
358250
184.8
79.2%
Smith
Tennessee
40
16148
247.7
106.1%
St.ewart
Tennessee
25
13549
184.5
79.0%
Sullivan
Tennessee
168
69085
243.2
104.2%
Sumner
Tennessee
65
32719
198.7
85.1%
Tipton
Tennessee
49
28036
174.8
74.9%
Trousdale
Tennessee
12
6113
196.3
84.1%
Unicoi
Tennessee
54
14128
382.2
163.7%
Union
Tennessee
13
9030
144.0
61.7%
Van Buren
Tennessee
9
4090
220.0
94.3%
Warren
Tennessee
44
19764
222.6
95.4%
Washington
Tennessee
137
51631
265.3
113.7%
Wayne
Tennessee
32
13638
234.6
100.5%
Weakley
Tennessee
51
29498
172.9
74.1%
White
Tennessee
47
15983
294.1
126.0%
Williamson
Tennessee
56
25220
222.0
95.1%
Wilson
Tennessee
52
25267
205.8
88.2%
Anderson
Texas
70
37092
188.7
80.8%
Andrews
Texas
8
1277
626.5
268.3%
Angelina
Texas
77
32201
239.1
102.4%
Aransas
Texas
9
3469
259.4
111.1%
Archer
Texas
26
7599
342.2
146.6%
Armstrong
Texas
8
2495
320.6
137.3%
Atascosa
Texas
50
19275
259.4
111.1%
Austin
Texas
41
17384
235.8
101.0%
Bailey
Texas
12
6318
189.9
81.4%
Bandera
Texas
14
4234
330.7
141.6%
Bastrop
Texas
59
21610
273.0
116.9%
Baylor
Texas
21
7755
270.8
116.0%
Bee
Texas
28
16481
169.9
72.8%
Bell
Texas
123
44863
274.2
117.4%
Bexar
Texas
1075
338176
317.9
136.2%
Blanco
Texas
14
4264
328.3
140.6%
Borden
Texas
7
1396
501.4
214.8%
Bosque
Texas
35
15761
222.1
95.1%
Bowie
Texas
131
50208
260.9
111.8%
Brazoria
Texas
61
27069
225.4
96.5%
Brazos
Texas
62
26977
229.8
98.4%
Brewster
Texas
21
6478
324.2
138.9%
Briscoe
Texas
14
4056
345.2
147.9%
Brooks
Texas
19
6362
298.6
127.9%
Brown
Texas
104
25924
401.2
171.8%
Burleson
Texas
28
18334
152.7
65.4%
Burnet
Texas
32
10771
297.1
127.3%
Caldwell
Texas
59
24893
237.0
101.5%
Calhoun
Texas
23
5911
389.1
166.7%
Callahan
Texas
37
11568
319.8
137.0%
Cameron
Texas
182
83202
218.7
93.7%
Camp
Texas
23
10285
223.6
95.8%
Carson
Texas
24
6624
362.3
155.2%
Cass
Texas
71
33496
212.0
90.8%
Castro
Texas
5
4631
108.0
46.2%
Chambers
Texas
14
7511
186.4
79.8%
Cherokee
Texas
72
43970
163.7
70.1%
Childress
Texas
34
12149
279.9
119.9%
Clay
Texas
29
12524
231.6
99.2%
Cochran
Texas
21
3735
562.2
240.8%
Coke
Texas
15
4590
326.8
140.0%
Coleman
Texas
57
20571
277.1
118.7%
Collin
Texas
117
47190
247.9
106.2%
Collingsworth
Texas
30
10331
290.4
124.4%
Colorado
Texas
33
17812
185.3
79.4%
Comal
Texas
28
12321
227.3
97.3%
Comanche
Texas
47
19245
244.2
104.6%
Concho
Texas
19
6192
306.8
131.4%
Cooke
Texas
81
24909
325.2
139.3%
Coryell
Texas
62
20226
306.5
131.3%
Cottle
Texas
27
7079
381.4
163.4%
Crane
Texas
7
2841
246.4
105.5%
Crockett
Texas
12
2809
427.2
183.0%
Crosby
Texas
21
10046
209.0
89.5%
Culberson
Texas
7
1653
423.5
181.4%
Dallam
Texas
24
6494
369.6
158.3%
Dallas
Texas
1038
398564
260.4
111.6%
Dawson
Texas
41
15367
266.8
114.3%
Deaf Smith
Texas
22
6056
363.3
155.6%
Delta
Texas
32
12858
248.9
106.6%
Denton
Texas
83
33658
246.6
105.6%
De Witt
Texas
49
24935
196.5
84.2%
Dickens
Texas
24
7847
305.8
131.0%
Dimmit
Texas
11
8542
128.8
55.2%
Donley
Texas
25
7487
333.9
143.0%
Duval
Texas
37
20565
179.9
77.1%
Eastland
Texas
82
30345
270.2
115.8%
Ector
Texas
36
15051
239.2
102.5%
Edwards
Texas
9
2933
306.9
131.4%
Ellis
Texas
107
47733
224.2
96.0%
El Paso
Texas
369
131067
281.5
120.6%
Erath
Texas
75
20760
361.3
154.8%
Falls
Texas
56
35984
155.6
66.7%
Fannin
Texas
97
41064
236.2
101.2%
Fayette
Texas
69
29246
235.9
101.1%
Fisher
Texas
29
12932
224.2
96.1%
Floyd
Texas
23
10659
215.8
92.4%
Foard
Texas
16
5237
305.5
130.9%
Fort Bend
Texas
54
32963
163.8
70.2%
Franklin
Texas
21
8378
250.7
107.4%
Freestone
Texas
36
21138
170.3
73.0%
Frio
Texas
15
9207
162.9
69.8%
Gaines
Texas
17
8136
208.9
89.5%
Galveston
Texas
178
81173
219.3
93.9%
Garza
Texas
14
5678
246.6
105.6%
Gillespie
Texas
22
10670
206.2
88.3%
Glasscock
Texas
4
1193
335.3
143.6%
Goliad
Texas
21
8798
238.7
102.2%
Gonzales
Texas
62
26075
237.8
101.9%
Gray
Texas
60
23911
250.9
107.5%
Grayson
Texas
179
69499
257.6
110.3%
Gregg
Texas
127
58027
218.9
93.7%
Grimes
Texas
35
21960
159.4
68.3%
Guadalupe
Texas
41
25596
160.2
68.6%
Hale
Texas
59
18813
313.6
134.3%
Hall
Texas
41
12117
338.4
144.9%
Hamilton
Texas
43
13303
323.2
138.5%
Hansford
Texas
10
2783
359.3
153.9%
Hardeman
Texas
22
11073
198.7
85.1%
Hardin
Texas
29
15875
182.7
78.2%
Harris
Texas
1059
528961
200.2
85.8%
Harrison
Texas
59
50900
115.9
49.7%
Hartley
Texas
6
1873
320.3
137.2%
Haskell
Texas
47
14905
315.3
135.1%
Hays
Texas
36
15349
234.5
100.5%
Hemphill
Texas
17
4170
407.7
174.6%
Henderson
Texas
75
31822
235.7
101.0%
Hidalgo
Texas
208
106059
196.1
84.0%
Hill
Texas
95
38355
247.7
106.1%
Hockley
Texas
27
12693
212.7
91.1%
Hood
Texas
21
6674
314.7
134.8%
Hopkins
Texas
67
30274
221.3
94.8%
Houston
Texas
91
31137
292.3
125.2%
Howard
Texas
66
20990
314.4
134.7%
Hudspeth
Texas
7
3149
222.3
95.2%
Hunt
Texas
117
48793
239.8
102.7%
Hutchinson
Texas
42
19069
220.3
94.3%
Irion
Texas
6
1963
305.7
130.9%
Jack
Texas
37
10206
362.5
155.3%
Jackson
Texas
22
11720
187.7
80.4%
Jasper
Texas
36
17491
205.8
88.2%
Jeff Davis
Texas
5
2375
210.5
90.2%
Jefferson
Texas
326
145329
224.3
96.1%
Jim Hogg
Texas
10
5449
183.5
78.6%
Jim Wells
Texas
58
20239
286.6
122.8%
Johnson
Texas
81
30384
266.6
114.2%
Jones
Texas
62
23378
265.2
113.6%
Karnes
Texas
35
19248
181.8
77.9%
Kaufman
Texas
74
38308
193.2
82.7%
Kendall
Texas
10
5080
196.9
84.3%
Kenedy
Texas
4
700
571.4
244.8%
Kent
Texas
16
3413
468.8
200.8%
Kerr
Texas
31
11650
266.1
114.0%
Kimble
Texas
14
5064
276.5
118.4%
King
Texas
0
1066
0.0
0.0%
Kinney
Texas
24
4533
529.5
226.8%
Kleberg
Texas
35
13344
262.3
112.4%
Knox
Texas
25
10090
247.8
106.1%
Lamar
Texas
116
50425
230.0
98.5%
Lamb
Texas
42
17606
238.6
102.2%
Lampasas
Texas
28
9167
305.4
130.8%
La Salle
Texas
30
8003
374.9
160.6%
Lavaca
Texas
90
25485
353.1
151.3%
Lee
Texas
21
12751
164.7
70.5%
Leon
Texas
42
17733
236.8
101.5%
Liberty
Texas
52
24541
211.9
90.8%
Limestone
Texas
76
33781
225.0
96.4%
Lipscomb
Texas
10
3764
265.7
113.8%
Live Oak
Texas
14
9799
142.9
61.2%
Llano
Texas
13
5996
216.8
92.9%
Loving
Texas
4
285
1403.5
601.2%
Lubbock
Texas
171
51782
330.2
141.5%
Lynn
Texas
35
11931
293.4
125.7%
Madison
Texas
13
12029
108.1
46.3%
Marion
Texas
10
11457
87.3
37.4%
Martin
Texas
15
5556
270.0
115.6%
Mason
Texas
14
5378
260.3
111.5%
Matagorda
Texas
47
20066
234.2
100.3%
Maverick
Texas
30
10071
297.9
127.6%
Mcculloch
Texas
42
13208
318.0
136.2%
Mclennan
Texas
291
101898
285.6
122.3%
Mcmullen
Texas
8
1374
582.2
249.4%
Medina
Texas
23
16106
142.8
61.2%
Menard
Texas
21
4521
464.5
199.0%
Midland
Texas
41
11721
349.8
149.8%
Milam
Texas
73
33120
220.4
94.4%
Mills
Texas
19
7951
239.0
102.4%
Mitchell
Texas
35
12477
280.5
120.2%
Montague
Texas
56
20442
273.9
117.3%
Montgomery
Texas
44
23055
190.8
81.7%
Moore
Texas
13
4461
291.4
124.8%
Morris
Texas
22
9810
224.3
96.1%
Motley
Texas
10
4994
200.2
85.8%
Nacogdoches
Texas
81
35392
228.9
98.0%
Navarro
Texas
116
51308
226.1
96.8%
Newton
Texas
13
13700
94.9
40.6%
Nolan
Texas
64
17309
369.7
158.4%
Nueces
Texas
244
92661
263.3
112.8%
Ochiltree
Texas
12
4213
284.8
122.0%
Oldham
Texas
8
1385
577.6
247.4%
Orange
Texas
52
17382
299.2
128.1%
Palo Pinto
Texas
48
18456
260.1
111.4%
Panola
Texas
34
22513
151.0
64.7%
Parker
Texas
62
20482
302.7
129.7%
Parmer
Texas
15
5890
254.7
109.1%
Pecos
Texas
23
8185
281.0
120.4%
Polk
Texas
43
20635
208.4
89.3%
Potter
Texas
166
54265
305.9
131.0%
Presidio
Texas
29
10925
265.4
113.7%
Rains
Texas
16
7334
218.2
93.4%
Randall
Texas
17
7185
236.6
101.3%
Reagan
Texas
8
1997
400.6
171.6%
Real
Texas
7
2420
289.3
123.9%
Red River
Texas
84
29769
282.2
120.9%
Reeves
Texas
23
8006
287.3
123.1%
Refugio
Texas
28
10383
269.7
115.5%
Roberts
Texas
5
1289
387.9
166.2%
Robertson
Texas
47
25710
182.8
78.3%
Rockwall
Texas
17
7051
241.1
103.3%
Runnels
Texas
46
18903
243.3
104.2%
Rusk
Texas
86
51023
168.6
72.2%
Sabine
Texas
21
10896
192.7
82.6%
San Augustine
Texas
22
12471
176.4
75.6%
San Jacinto
Texas
15
9056
165.6
70.9%
San Patricio
Texas
49
28871
169.7
72.7%
San Saba
Texas
21
11012
190.7
81.7%
Schleicher
Texas
3
3083
97.3
41.7%
Scurry
Texas
45
11545
389.8
167.0%
Shackelford
Texas
15
6211
241.5
103.4%
Shelby
Texas
85
29235
290.7
124.5%
Sherman
Texas
5
2026
246.8
105.7%
Smith
Texas
115
69090
166.4
71.3%
Somervell
Texas
5
3071
162.8
69.7%
St.arr
Texas
41
13312
308.0
131.9%
St.ephens
Texas
33
12356
267.1
114.4%
St.erling
Texas
4
1404
284.9
122.0%
St.onewall
Texas
14
5589
250.5
107.3%
Sutton
Texas
13
3977
326.9
140.0%
Swisher
Texas
26
6528
398.3
170.6%
Tarrant
Texas
584
225521
259.0
110.9%
Taylor
Texas
135
44147
305.8
131.0%
Terrell
Texas
16
2952
542.0
232.2%
Terry
Texas
36
11160
322.6
138.2%
Throckmorton
Texas
18
4275
421.1
180.4%
Titus
Texas
46
19228
239.2
102.5%
Tom Green
Texas
101
39302
257.0
110.1%
Travis
Texas
231
111053
208.0
89.1%
Trinity
Texas
31
13705
226.2
96.9%
Tyler
Texas
29
11948
242.7
104.0%
Upshur
Texas
38
26178
145.2
62.2%
Upton
Texas
8
4297
186.2
79.7%
Uvalde
Texas
44
13246
332.2
142.3%
Val Verde
Texas
43
15453
278.3
119.2%
Van Zandt
Texas
70
31155
224.7
96.2%
Victoria
Texas
74
23741
311.7
133.5%
Walker
Texas
36
19868
181.2
77.6%
Waller
Texas
18
10280
175.1
75.0%
Ward
Texas
27
9575
282.0
120.8%
Washington
Texas
39
25387
153.6
65.8%
Webb
Texas
123
45916
267.9
114.7%
Wharton
Texas
61
36158
168.7
72.3%
Wheeler
Texas
36
12411
290.1
124.2%
Wichita
Texas
189
73604
256.8
110.0%
Wilbarger
Texas
52
20474
254.0
108.8%
Willacy
Texas
25
13230
189.0
80.9%
Williamson
Texas
74
41698
177.5
76.0%
Wilson
Texas
39
17066
228.5
97.9%
Winkler
Texas
17
6141
276.8
118.6%
Wise
Texas
54
19074
283.1
121.3%
Wood
Texas
76
24360
312.0
133.6%
Yoakum
Texas
7
5354
130.7
56.0%
Young
Texas
65
19004
342.0
146.5%
Zapata
Texas
7
3916
178.8
76.6%
Zavala
Texas
28
11603
241.3
103.4%
Beaver
Utah
14
5014
279.2
119.6%
Box Elder
Utah
59
18832
313.3
134.2%
Cache
Utah
82
29797
275.2
117.9%
Carbon
Utah
55
18459
298.0
127.6%
Daggett
Utah
3
564
531.9
227.8%
Davis
Utah
40
15784
253.4
108.6%
Duchesne
Utah
27
8958
301.4
129.1%
Emery
Utah
16
7072
226.2
96.9%
Garfield
Utah
15
5253
285.6
122.3%
Grand
Utah
8
2070
386.5
165.5%
Iron
Utah
21
8331
252.1
108.0%
Juab
Utah
12
7392
162.3
69.5%
Kane
Utah
7
2561
273.3
117.1%
Millard
Utah
28
9613
291.3
124.8%
Morgan
Utah
12
2611
459.6
196.9%
Piute
Utah
3
2203
136.2
58.3%
Rich
Utah
9
2028
443.8
190.1%
Salt Lake
Utah
520
211623
245.7
105.3%
San Juan
Utah
10
4712
212.2
90.9%
Sanpete
Utah
43
16063
267.7
114.7%
Sevier
Utah
17
12112
140.4
60.1%
Summit
Utah
10
8714
114.8
49.2%
Tooele
Utah
26
9133
284.7
121.9%
Uintah
Utah
30
9898
303.1
129.8%
Utah
Utah
149
57382
259.7
111.2%
Wasatch
Utah
18
5754
312.8
134.0%
Washington
Utah
31
9269
334.4
143.3%
Wayne
Utah
3
2394
125.3
53.7%
Weber
Utah
160
56714
282.1
120.8%
Accomack
Virginia
43
33030
130.2
55.8%
Albemarle
Virginia
108
24652
438.1
187.7%
Alleghany
Virginia
76
22688
335.0
143.5%
Amelia
Virginia
16
8495
188.3
80.7%
Amherst
Virginia
39
20273
192.4
82.4%
Appomattox
Virginia
14
9020
155.2
66.5%
Arlington
Virginia
225
57040
394.5
169.0%
Augusta
Virginia
125
42772
292.2
125.2%
Bath
Virginia
29
7191
403.3
172.7%
Bedford
Virginia
80
29687
269.5
115.4%
Bland
Virginia
19
6731
282.3
120.9%
Botetourt
Virginia
19
16447
115.5
49.5%
Brunswick
Virginia
24
19575
122.6
52.5%
Buchanan
Virginia
65
31477
206.5
88.5%
Buckingham
Virginia
27
13398
201.5
86.3%
Campbell
Virginia
170
26048
652.6
279.6%
Caroline
Virginia
14
13945
100.4
43.0%
Carroll
Virginia
57
25904
220.0
94.3%
Charles City
Virginia
7
4275
163.7
70.1%
Charlotte
Virginia
49
15861
308.9
132.3%
Chesterfield
Virginia
52
31183
166.8
71.4%
Clarke
Virginia
26
7159
363.2
155.6%
Craig
Virginia
8
3769
212.3
90.9%
Culpeper
Virginia
26
13365
194.5
83.3%
Cumberland
Virginia
10
7505
133.2
57.1%
Dickenson
Virginia
64
21266
300.9
128.9%
Dinwiddie
Virginia
100
18166
550.5
235.8%
Elizabeth City
Virginia
87
32283
269.5
115.4%
Essex
Virginia
19
7006
271.2
116.2%
Fairfax
Virginia
70
40929
171.0
73.3%
Fauquier
Virginia
55
21039
261.4
112.0%
Floyd
Virginia
34
11967
284.1
121.7%
Fluvanna
Virginia
18
7088
254.0
108.8%
Franklin
Virginia
50
25864
193.3
82.8%
Frederick
Virginia
57
14008
406.9
174.3%
Giles
Virginia
47
14635
321.1
137.6%
Gloucester
Virginia
14
9548
146.6
62.8%
Goochland
Virginia
15
8454
177.4
76.0%
Grayson
Virginia
69
21916
314.8
134.9%
Greene
Virginia
16
5218
306.6
131.3%
Greensville
Virginia
17
14866
114.4
49.0%
Halifax
Virginia
76
41271
184.1
78.9%
Hanover
Virginia
33
18500
178.4
76.4%
Henrico
Virginia
483
41960
1151.1
493.1%
Henry
Virginia
97
26481
366.3
156.9%
Highland
Virginia
18
4875
369.2
158.2%
Isle Of Wight
Virginia
12
13381
89.7
38.4%
James City
Virginia
20
4907
407.6
174.6%
King And Queen
Virginia
14
6954
201.3
86.2%
King George
Virginia
15
5431
276.2
118.3%
King William
Virginia
13
7855
165.5
70.9%
Lancaster
Virginia
16
8786
182.1
78.0%
Lee
Virginia
101
39296
257.0
110.1%
Loudoun
Virginia
36
20291
177.4
76.0%
Louisa
Virginia
20
13665
146.4
62.7%
Lunenburg
Virginia
39
13844
281.7
120.7%
Madison
Virginia
21
8465
248.1
106.3%
Mathews
Virginia
10
7149
139.9
59.9%
Mecklenburg
Virginia
52
31933
162.8
69.8%
Middlesex
Virginia
11
6673
164.8
70.6%
Montgomery
Virginia
107
21206
504.6
216.1%
Nansemond (ext)
Virginia
43
22771
188.8
80.9%
Nelson
Virginia
45
16241
277.1
118.7%
New Kent
Virginia
6
4092
146.6
62.8%
Norfolk (city)
Virginia
502
144332
347.8
149.0%
Northampton
Virginia
46
17597
261.4
112.0%
Northumberland
Virginia
12
10463
114.7
49.1%
Nottoway
Virginia
35
15556
225.0
96.4%
Orange
Virginia
23
12649
181.8
77.9%
Page
Virginia
19
14863
127.8
54.8%
Patrick
Virginia
35
16613
210.7
90.2%
Pittsylvania
Virginia
199
61697
322.5
138.2%
Powhatan
Virginia
20
5671
352.7
151.1%
Prince Edward
Virginia
40
14922
268.1
114.8%
Prince George
Virginia
40
12226
327.2
140.1%
Prince William
Virginia
29
17738
163.5
70.0%
Pulaski
Virginia
52
22767
228.4
97.8%
Rappahannock
Virginia
14
7208
194.2
83.2%
Richmond
Virginia
54
6634
814.0
348.7%
Roanoke
Virginia
315
42897
734.3
314.5%
Rockbridge
Virginia
60
22384
268.0
114.8%
Rockingham
Virginia
89
31289
284.4
121.8%
Russell
Virginia
67
26627
251.6
107.8%
Scott
Virginia
59
26989
218.6
93.6%
Shenandoah
Virginia
52
20898
248.8
106.6%
Smyth
Virginia
76
28861
263.3
112.8%
Southampton
Virginia
28
26442
105.9
45.4%
Spotsylvania
Virginia
46
9905
464.4
198.9%
St.afford
Virginia
15
9548
157.1
67.3%
Surry
Virginia
9
6193
145.3
62.2%
Sussex
Virginia
15
12485
120.1
51.5%
Tazewell
Virginia
130
41607
312.4
133.8%
Warren
Virginia
27
11352
237.8
101.9%
Warwick
Virginia
101
9248
1092.1
467.8%
Washington
Virginia
120
38197
314.2
134.6%
Westmoreland
Virginia
20
9512
210.3
90.1%
Wise
Virginia
165
52458
314.5
134.7%
Wythe
Virginia
66
22721
290.5
124.4%
York
Virginia
7
8857
79.0
33.9%
Addison
Vermont
53
17944
295.4
126.5%
Bennington
Vermont
52
22286
233.3
99.9%
Caledonia
Vermont
50
24320
205.6
88.1%
Chittenden
Vermont
140
52098
268.7
115.1%
Essex
Vermont
22
6490
339.0
145.2%
Franklin
Vermont
63
29601
212.8
91.2%
Grand Isle
Vermont
10
3802
263.0
112.7%
Lamoille
Vermont
28
11028
253.9
108.8%
Orange
Vermont
21
17048
123.2
52.8%
Orleans
Vermont
64
21718
294.7
126.2%
Rutland
Vermont
110
45638
241.0
103.2%
Washington
Vermont
86
41546
207.0
88.7%
Windham
Vermont
58
27850
208.3
89.2%
Windsor
Vermont
102
37862
269.4
115.4%
Adams
Washington
13
6209
209.4
89.7%
Asotin
Washington
25
8365
298.9
128.0%
Benton
Washington
34
12053
282.1
120.8%
Chelan
Washington
61
34412
177.3
75.9%
Clallam
Washington
45
21848
206.0
88.2%
Clark
Washington
150
49852
300.9
128.9%
Columbia
Washington
19
5549
342.4
146.7%
Cowlitz
Washington
92
40155
229.1
98.1%
Douglas
Washington
17
8651
196.5
84.2%
Ferry
Washington
11
4701
234.0
100.2%
Franklin
Washington
21
6307
333.0
142.6%
Garfield
Washington
7
3383
206.9
88.6%
Grant
Washington
25
14668
170.4
73.0%
Grays Harbor
Washington
121
53166
227.6
97.5%
Island
Washington
10
6098
164.0
70.2%
Jefferson
Washington
16
8918
179.4
76.9%
King
Washington
1106
504980
219.0
93.8%
Kitsap
Washington
142
44387
319.9
137.0%
Kittitas
Washington
57
20230
281.8
120.7%
Klickitat
Washington
22
11357
193.7
83.0%
Lewis
Washington
110
41393
265.7
113.8%
Lincoln
Washington
28
11361
246.5
105.6%
Mason
Washington
28
11603
241.3
103.4%
Okanogan
Washington
45
24546
183.3
78.5%
Pacific
Washington
33
15928
207.2
88.7%
Pend Oreille
Washington
15
7156
209.6
89.8%
Pierce
Washington
417
182081
229.0
98.1%
San Juan
Washington
5
3157
158.4
67.8%
Skagit
Washington
81
37650
215.1
92.2%
Skamania
Washington
4
4633
86.3
37.0%
Snohomish
Washington
189
88754
212.9
91.2%
Spokane
Washington
396
164652
240.5
103.0%
St.evens
Washington
52
19275
269.8
115.6%
Thurston
Washington
67
37285
179.7
77.0%
Wahkiakum
Washington
3
4286
70.0
30.0%
Walla Walla
Washington
70
30547
229.2
98.2%
Whatcom
Washington
114
60355
188.9
80.9%
Whitman
Washington
45
27221
165.3
70.8%
Yakima
Washington
224
99019
226.2
96.9%
Adams
Wisconsin
10
8449
118.4
50.7%
Ashland
Wisconsin
68
21801
311.9
133.6%
Barron
Wisconsin
69
34289
201.2
86.2%
Bayfield
Wisconsin
38
15827
240.1
102.8%
Brown
Wisconsin
185
83109
222.6
95.3%
Buffalo
Wisconsin
24
16090
149.2
63.9%
Burnett
Wisconsin
24
11382
210.9
90.3%
Calumet
Wisconsin
29
17618
164.6
70.5%
Chippewa
Wisconsin
78
40703
191.6
82.1%
Clark
Wisconsin
80
33972
235.5
100.9%
Columbia
Wisconsin
73
32517
224.5
96.2%
Crawford
Wisconsin
38
18328
207.3
88.8%
Dane
Wisconsin
330
130660
252.6
108.2%
Dodge
Wisconsin
95
54280
175.0
75.0%
Door
Wisconsin
40
19095
209.5
89.7%
Douglas
Wisconsin
143
47119
303.5
130.0%
Dunn
Wisconsin
61
27375
222.8
95.4%
Eau Claire
Wisconsin
84
46999
178.7
76.6%
Florence
Wisconsin
10
4177
239.4
102.5%
Fond Du Lac
Wisconsin
127
62353
203.7
87.2%
Forest
Wisconsin
31
11805
262.6
112.5%
Grant
Wisconsin
88
40639
216.5
92.8%
Green
Wisconsin
23
23146
99.4
42.6%
Green Lake
Wisconsin
29
14092
205.8
88.1%
Iowa
Wisconsin
34
20595
165.1
70.7%
Iron
Wisconsin
34
10049
338.3
144.9%
Jackson
Wisconsin
39
16599
235.0
100.6%
Jefferson
Wisconsin
76
38868
195.5
83.8%
Juneau
Wisconsin
41
18708
219.2
93.9%
Kenosha
Wisconsin
151
63505
237.8
101.9%
Kewaunee
Wisconsin
32
16680
191.8
82.2%
La Crosse
Wisconsin
125
59653
209.5
89.8%
Lafayette
Wisconsin
39
18695
208.6
89.4%
Langlade
Wisconsin
68
23227
292.8
125.4%
Lincoln
Wisconsin
59
22536
261.8
112.1%
Manitowoc
Wisconsin
131
61617
212.6
91.1%
Marathon
Wisconsin
152
75915
200.2
85.8%
Marinette
Wisconsin
78
36225
215.3
92.2%
Marquette
Wisconsin
17
9097
186.9
80.0%
Milwaukee
Wisconsin
1684
766885
219.6
94.1%
Monroe
Wisconsin
73
30080
242.7
104.0%
Oconto
Wisconsin
60
27075
221.6
94.9%
Oneida
Wisconsin
61
18938
322.1
138.0%
Outagamie
Wisconsin
155
70032
221.3
94.8%
Ozaukee
Wisconsin
44
18985
231.8
99.3%
Pepin
Wisconsin
11
7897
139.3
59.7%
Pierce
Wisconsin
56
21471
260.8
111.7%
Polk
Wisconsin
54
26197
206.1
88.3%
Portage
Wisconsin
85
35800
237.4
101.7%
Price
Wisconsin
69
18467
373.6
160.0%
Racine
Wisconsin
245
94047
260.5
111.6%
Richland
Wisconsin
38
20381
186.4
79.9%
Rock
Wisconsin
237
80173
295.6
126.6%
Rusk
Wisconsin
34
17737
191.7
82.1%
Sauk
Wisconsin
89
33700
264.1
113.1%
Sawyer
Wisconsin
39
11540
338.0
144.8%
Shawano
Wisconsin
74
35378
209.2
89.6%
Sheboygan
Wisconsin
153
76221
200.7
86.0%
St Croix
Wisconsin
46
24842
185.2
79.3%
Taylor
Wisconsin
39
20105
194.0
83.1%
Trempealeau
Wisconsin
48
24381
196.9
84.3%
Vernon
Wisconsin
51
29940
170.3
73.0%
Vilas
Wisconsin
23
8894
258.6
110.8%
Walworth
Wisconsin
64
33103
193.3
82.8%
Washburn
Wisconsin
26
12496
208.1
89.1%
Washington
Wisconsin
57
28430
200.5
85.9%
Waukesha
Wisconsin
121
62744
192.8
82.6%
Waupaca
Wisconsin
56
34614
161.8
69.3%
Waushara
Wisconsin
21
14268
147.2
63.0%
Winnebago
Wisconsin
164
80507
203.7
87.3%
Wood
Wisconsin
123
44465
276.6
118.5%
Barbour
West Virginia
40
19869
201.3
86.2%
Berkeley
West Virginia
77
29016
265.4
113.7%
Boone
West Virginia
77
28556
269.6
115.5%
Braxton
West Virginia
68
21658
314.0
134.5%
Brooke
West Virginia
87
25513
341.0
146.1%
Cabell
West Virginia
208
97459
213.4
91.4%
Calhoun
West Virginia
24
12455
192.7
82.5%
Clay
West Virginia
48
15206
315.7
135.2%
Doddridge
West Virginia
29
10923
265.5
113.7%
Fayette
West Virginia
223
80628
276.6
118.5%
Gilmer
West Virginia
23
12046
190.9
81.8%
Grant
West Virginia
18
8805
204.4
87.6%
Greenbrier
West Virginia
88
38520
228.5
97.9%
Hampshire
West Virginia
36
12974
277.5
118.9%
Hancock
West Virginia
111
31572
351.6
150.6%
Hardy
West Virginia
25
10813
231.2
99.0%
Harrison
West Virginia
201
82911
242.4
103.8%
Jackson
West Virginia
38
16598
228.9
98.1%
Jefferson
West Virginia
33
16762
196.9
84.3%
Kanawha
West Virginia
500
195619
255.6
109.5%
Lewis
West Virginia
56
22271
251.4
107.7%
Lincoln
West Virginia
69
22886
301.5
129.1%
Logan
West Virginia
167
67768
246.4
105.6%
Marion
West Virginia
173
68683
251.9
107.9%
Marshall
West Virginia
103
40189
256.3
109.8%
Mason
West Virginia
58
22270
260.4
111.6%
Mcdowell
West Virginia
235
94354
249.1
106.7%
Mercer
West Virginia
173
68289
253.3
108.5%
Mineral
West Virginia
76
22215
342.1
146.5%
Mingo
West Virginia
89
40802
218.1
93.4%
Monongalia
West Virginia
156
51252
304.4
130.4%
Monroe
West Virginia
44
13577
324.1
138.8%
Morgan
West Virginia
25
8743
285.9
122.5%
Nicholas
West Virginia
58
24070
241.0
103.2%
Ohio
West Virginia
216
73115
295.4
126.5%
Pendleton
West Virginia
35
10884
321.6
137.7%
Pleasants
West Virginia
15
6692
224.1
96.0%
Pocahontas
West Virginia
38
13906
273.3
117.1%
Preston
West Virginia
73
30416
240.0
102.8%
Putnam
West Virginia
41
19511
210.1
90.0%
Raleigh
West Virginia
200
86687
230.7
98.8%
Randolph
West Virginia
84
30259
277.6
118.9%
Ritchie
West Virginia
48
15389
311.9
133.6%
Roane
West Virginia
49
20787
235.7
101.0%
Summers
West Virginia
53
20409
259.7
111.2%
Taylor
West Virginia
36
19919
180.7
77.4%
Tucker
West Virginia
35
13173
265.7
113.8%
Tyler
West Virginia
34
12559
270.7
116.0%
Upshur
West Virginia
54
18360
294.1
126.0%
Wayne
West Virginia
82
35566
230.6
98.8%
Webster
West Virginia
48
18080
265.5
113.7%
Wetzel
West Virginia
55
22342
246.2
105.4%
Wirt
West Virginia
18
6475
278.0
119.1%
Wood
West Virginia
107
62399
171.5
73.5%
Wyoming
West Virginia
74
29774
248.5
106.5%
Albany
Wyoming
39
13946
279.7
119.8%
Big Horn
Wyoming
27
12911
209.1
89.6%
Campbell
Wyoming
15
6048
248.0
106.2%
Carbon
Wyoming
48
12644
379.6
162.6%
Converse
Wyoming
18
6631
271.5
116.3%
Crook
Wyoming
10
5463
183.0
78.4%
Fremont
Wyoming
35
16095
217.5
93.1%
Goshen
Wyoming
29
12207
237.6
101.8%
Hot Springs
Wyoming
12
4607
260.5
111.6%
Johnson
Wyoming
13
4980
261.0
111.8%
Laramie
Wyoming
98
33651
291.2
124.7%
Lincoln
Wyoming
21
10286
204.2
87.5%
Natrona
Wyoming
52
23858
218.0
93.4%
Niobrara
Wyoming
8
5988
133.6
57.2%
Park
Wyoming
32
10976
291.5
124.9%
Platte
Wyoming
25
8013
312.0
133.6%
Sheridan
Wyoming
46
19255
238.9
102.3%
Sublette
Wyoming
6
2778
216.0
92.5%
Sweetwater
Wyoming
50
19407
257.6
110.4%
Teton
Wyoming
6
2543
235.9
101.1%
Uinta
Wyoming
18
7223
249.2
106.7%
Washakie
Wyoming
19
5858
324.3
138.9%
Weston
Wyoming
15
4958
302.5
129.6%
Yellowstone Np (pt)
Wyoming
0
416
0.0
0.0%
Graphing the counties according to these statistics reveals something of a “normal” distribution. I should note that sparsely populated counties often exceeded the national norm, although that is often simply a function of math. When Private First Class Keith E. Eberl of Armstrong County, South Dakota, population 42, was killed in action, Armstrong, a county that no longer exists, endured a per capita loss of 2,380 per 100k.
However, as we shall see, what is interesting is that the highly populated counties throughout the country (except for the South, more on that later) fell along the national per capita. Highly populated areas like Chicago, Los Angeles, and New York City sent their boys to fight and die at rates largely in line with the national average (graphic two). The boroughs of New York sent so many of its residents that Army records broke out their losses separately from that of the state of New York. 27,659 New Yorkers were killed in the war.
Graphic 2: This graphic depicts U.S. counties and their relative and absolute Army and Army Air Forces fatalities suffered during the Second World War. Unlike the later wars of the 20th century, the Second World War, thanks to mass mobilization and conscription, led to a generally well-distributed burden in military fatalities. Each dot represents a U.S. county. Each county is colorized and faceted by its region and sized by the number of absolute losses it endured. Each dot is situated on an x-axis determined by its population in 1940 and a y-axis that denotes it’s per capita loss. The national average of 232 and the mean county population in 1940, 83,674 are highlighted.
These regional trends began to change first with Korea and then with Vietnam, but not as dramatically as what would come later. During the Big One, of the top 50 most populated counties, 44 were within 90% (or higher) of the national per 100.2 By the Korean War, it fell dramatically to 14 of the top 50 populated counties but rose again in Vietnam to 23. While the geographical spread had indeed changed by Vietnam, a number of America’s most populous counties still pulled their weight. Los Angeles (26.6), Wayne County, MI (which contains Detriot, 30.97), and Kings County, New York (52.6)3, to name a few, all nearly matched or exceeded the national average (graphic 3).
Graphic 3: This graphic depicts U.S. counties and their relative and absolute military suffered during the Vietnam War. The geographical pattern of Vietnam differed slightly from that of WWII, despite the presence of a draft. Yet, unlike the Global War on Terror, most highly populated counties fell only slightly below the national average, with many exceeding it. Each county is colorized and faceted by its region and sized by the number of absolute losses it endured. Each dot is situated on an x-axis determined by its population in 1970 and a y-axis that denotes its per capita loss. The national average of 28.6 and the mean county population in 1970, 127,285, are highlighted.
This would change dramatically with the end of conscription in 1973, coupled with socioeconomic and cultural changes associated with military service that arose thereafter. The All-Volunteer Force fundamentally transformed the face of the American military. As the Institute for Defense Analyses has noted, starting in the mid-1980s, recruitment in the Northeast dropped off the table and was largely replaced by Southern and Western states. In the wake of Vietnam, many of the North’s elite schools, including the Ivies, pushed ROTC programs off of their campuses. This slack was taken up by schools in the South and the West and contributed to the shift of identifying military service with their respective regions and political cultures.
The result was the accelerated decline of relative military fatalities from America’s most populated places, especially in the North. Only three of the 25 most populated counties during WWII failed to hit 90% of the national per capita average (Bronx County, St. Louis, and Harris County, Texas, 144, 200, and 200, respectively). If we fast forward to the Global War on Terror, only two of the 25 counties exceeded the national per capita average of 2.10 per 100k (using the 2020 census). See graphic 4.
Those two are Erie County, New York, which lost 27 of its residents (2.27 per 100k), and Baltimore City, which lost 25 (4.25 per 100k). Both are “Rusbelt” cities (the former contains Buffalo) that have bled off residents and their respective industrial bases. The economic landscapes of these counties, like rural areas, incentivized military service.
Graphic 4: This graphic depicts the 25 five most populous counties in the United States during World War II and their subsequent relative losses during Korea, Vietnam, and the Global War on Terror. Of the 25, only three failed to meet the national average, but by the GWOT, only two did. Each county’s relative losses are depicted in rows and titled according to war, from left to right: WWII, Korea, Vietnam, and the GWOT. Each county’s per capita loss in each war is depicted by its percentage in relation to the national average and colorized on a green-to-red ramp. Those in yellow did not differ from the national average in their respective war. The redder the tile, the higher the county’s relationship to the national average; the lower the relationship, the greener the tile.
The trend is reinforced by looking at modern population data. Of the 50 most populated counties in the United States (as defined by 2020 data), only seven met or exceeded the national per capita of military fatalities endured in the Global War on Terror. Two of them, San Diego, CA, and Bexar, TX, are military towns, examples of America’s now strained multigenerational military caste.
These transformations have pushed the burden of military fatalities down to less populated counties in the suburbs and exurbs (graphic 5). It should be noted, though, that most large counties still have lost a number of their resident in absolute terms. Los Angeles sacrificed 158, Cook County, 61. Yet these fatalities have been absorbed by massive populations and obscured by the growing socio-economic divide associated with military service. And, in an extreme example, Kings County, New York, population 2.7 million, lost no one in the Global War on Terror.
Graphic 5: This graphic depicts U.S. counties and their relative and absolute military suffered during the Global War on Terror. Each county is colorized and faceted by its region and sized by the number of absolute losses it endured. Each dot is situated on an x-axis determined by its population in 2020 and a y-axis that denotes its per capita loss. The national average of 2.10 and the mean county population in 2020, 103.922, are highlighted.
And now for the not-at-all controversial topic of race.
Remember earlier when I noted that the South lost significantly fewer of its residents relative to its population during WWII? Well, there is a reason for that: racism. A combination of exclusionary practices with the draft coupled with a general antipathy towards black combat troops meant a low number of black American wartime fatalities. Despite a number of notable black combat units in armor, infantry, and aviation, a relatively low number of black Americans died in WWII, an estimated 708.
I say estimated because, interestingly enough, the Army fatality records do not record the race (or sex, for that matter) of the deceased. Therefore, tracking racial statistics (an already fraught practice) is especially tough, and it is made tougher still given the black-and-white manner in which racial statistics were gathered in the U.S. in the 1940s (pardon the tasteless pun). Adding to the confusion was the ambiguity of Latinos in the American racial hierarchy of 1940. Latinos were, however, classified as white and served in integrated units.
Yet, if we plot per capita losses against the white population percentage, the South had a lower per capita loss rate as a region because half of its population was (largely) barred from combat (graphic 6). There were outliers, of course, particularly for a few counties in Virginia, but the general pattern holds.
Graphic 6: This graphic depicts the relative losses endured by states against their white populations in World War Two. A segregated military, hesitancy to draft black Americans, and general hostility toward sending blacks into combat meant fewer black fatalities and, therefore, lower per capita losses endured in the South. Each dot represents a state, colorized by its region, and is situated on an x-axis that depicts the percentage of its population defined as white and on a y-axis that shows its per 100k fatality rate.
The racial patterns of American combat changed after WWII with the continuation of the draft coupled with the integration of the military. While comparisons across time are difficult due to the changing and often capricious nature of American racial statistics, looking at the DoD’s own fatality statistics, it is clear that by Vietnam, the racial breakdown of American combat largely mirrored that of the county at large (see below).
Yet, since the advent of the All-Volunteer Force, the color of combat has become increasingly white. The elimination of the draft and the adoption of volunteer enlistment coupled with a contract system have created de-facto occupational segregation within the U.S. military, a fact that the Army has itself lamented (if for its own political reasons).
This systematic difference in career paths has led to racial disparities in fatalities endured during the Global War on Terror. As the Department of Defense has acknowledged in its own reporting and its own statistics, around 70% of the country’s GWOT fatalities are white, which is higher than the U.S. military and the nation at large.
There are exceptions, of course.While the DCAS data does not list racial statistics for individual soldiers, the records themselves are enlightening. Looking at the names of the fallen in heavily Latino counties, like Los Angeles, reveals a preponderance of Hispanic surnames, and Baltimore, a predominately black city, lost 32 of its residents, a per capita of 4.2, double the national average.
Yet these are the exceptions that prove the rule: America’s combat fatalities, for the first time since WWII, have become disproportionately white even as the military and, indeed, the country at large are becoming less so. They’ve also become disproportionately rural and underrepresented among America’s upper class. Long gone are the days of UCLA or Harvard sending its students and faculty to fight America’s wars.
The elimination of the draft, moral considerations aside, constructed a military caste within the United States, one served by a volunteer system. After 20 years of lost wars and amplifying domestic issues, that system is heavily under strain. As I argued in my earlier piece for antiwar.com:
These disparities in wartime losses expounded upon another conflict, the culture war. Conservatives, who are overrepresented among veterans, have come to view the foreign policy class and similar coastal elites (to include large swaths of the GOP) with abject disdain. While it is true that the US has been awash in militaristic pageantry since 2001, the right sees the national mood as inherently hostile if not downright contemptuous of them and their values. In their eyes, conservative principles are routinely mocked by the same social class which has sent them or their children to die needlessly abroad. Their home states are referred to derisively as “fly over country.” They have been called “bitter clingers” and “deplorables.” Their religion and patriotism are routinely mocked, as are their cultural values on abortion and guns. Their views on constitutional government are ridiculed as both ahistorical and outdated. They are routinely labeled as racists, sexists, Nazis, homophobes, and so on. Worst of all, they are increasingly compared to those that they fought and are seen as a growing terror threat.
It appears that America’s martial caste is now discouraging its sons and daughters from enlisting, draining the U.S. military’s strongest enlistment pool. Now, the smart set, on both the right and left, is floating the idea of bringing back the draft, often invoking World War II nostalgia, framing conscription as a form of “democracy.”
It should go without saying that the United States is not the same place that it was in 1940. Reinstating the draft would create more problems than it would solve. There is, of course, another less draconian solution to the question of who shall bear the burden of America’s future, one rarely floated by the smart set: lighten the load.
Lower the demand by bringing our troops home, make America’s “allies” pay for their own defense, and return to the republic we’re supposed to be. It’s a novel and perhaps impossible idea, but one worth clinging to lest we resign ourselves to future generations buckling under this imperious burden.
Steven Manson, Jonathan Schroeder, David Van Riper, Katherine Knowles, Tracy Kugler, Finn Roberts, and Steven Ruggles. IPUMS National Historical Geographic Information System: Version 18.0 [1915-1941 Vital Statistics: Natality & Mortality Data [States & Counties]]. Minneapolis, MN: IPUMS. 2023. http://doi.org/10.18128/D050.V18.0 ↩︎
I used this cut-off for World War II in order to account for the likelihood that naval losses would have put a given country over the threshold of meeting the national average. ↩︎
That number is likely inflated by an error in the DCAS dataset, one that did not record deaths for New York County. I suspect that residents of New York County were recorded as residing in Kings County, hence the elevated number. ↩︎
The recent drip of think pieces regarding the resurrection of conscription inspired me to revisit the antiwar ads featured below.
They are some haunting stuff designed to tug at the heartstrings. I first ran into them while researching at the Hoover Presidential Library, specifically while pouring through the Senator Gerald Nye Papers. As you can see, the images feature a mother tossing their smiling child with the text “To be Killed in Action” superimposed above.
The center image and the one on the right are posters/flyers related to a speaking tour put on by Senator Gerald Nye in order to sell the public on the newly proposed Neutrality Act, itself the result of his famed “Special Committee on Investigation of the Munitions Industry,” colloquially known as the Nye Committee.
I’ve looked into the ad’s origins and cannot pin it down for certain, although it appears that it at least ran in Esquiremagazine.
I have not found anything on the ad’s origins except for one other appearance on a vintage ad blog that places its origins in 1939, which can’t be correct as the copies I ran into have it at least as early as 1935. According to said blog:
The ad from a group called World Peaceways, in NYC is from 1939 before America entered WWII is remarkable in the fact that it ran as a full-page advertisement in an issue of “Woman’s Home Companion,” a mainstream woman’s magazine. It appeared alongside recipes for the 1930’s housewife for husband pleasin’ meals and advise on hanging dainty curtains. The contrasts between the usual vintage advertising to women and a daring war protest ad was startling.
If you’ve come this far, read the ads; they’re jarring historical documents. And even if you possess a completely orthodox view of “isolationism” and America’s entry into the war, I hope you can glean a modicum of sympathy for those who desired to stay out of Europe’s growing travails. Most simply didn’t want their children to die half a world away.
While researching chapter four ofmy dissertation, “Partisans of the Old Republic,” I stumbled upon a speech given by Representative Ronald Brooks Cameron (D-CA), entitled Who is Doing the Devil’s Work in American Politics?” on 20 May 1963. In his address, Cameron he lambasted the John Birch Society and its influence on conservative politics. His use of rhetoric, guilt by association, arguments from hypotheticals, and hyperbole is a useful window into the era’s crazed political climate and a useful tool for understanding our own political inanities.
A copy of Cameron’s speech within the Congressional Record can be found on the congress.gov website, and I uploaded a copy here.
The Birchers became a tool of political rhetoric and discipline, one used to limit the Overton Window and rein in the then-growing conservative movement. In a speech on the floor of the House of Representatives, Cameron[i] used the specter of the far-right to assail the John Birch Society and other conservative organizations and individuals within its orbit. Cameron’s speech, “Who is Doing the Devil’s Work in American Politics?” sought to tie the already controversial Birchers to the openly antisemitic Gerald L. K. Smith and his periodical Cross and the Flag. Cameron then used the fear of these two groups to question the legitimacy of the emerging conservative movement, declaring, “[w]e are all aware that democracy is under attack by the radical right.” After warning about the fate of democracy, he prefaced his accusations with a reminder of Robert Welch’s more outlandish claims; among them, President Eisenhower and John Foster Dulles were agents of the international communist conspiracy. Cameron further warned that the members of the society had already “infiltrated” Congress.
As with the America First Committee three decades earlier, Cameron highlighted and amplified the tenuous connection between these two camps of the right and then used the proximity of other conservative figures to the John Birch Society to control the Overton Window. His evidence of such a connection was Smith’s professed affinity for the John Birch Society due to its staunch anti-communism. He quoted Smith as declaring that “[f]ollowers of mine who have access to our literature should attend the John Birch Society meetings in their community.” However, Cameron noted that Smith complained that the society did not center its conspiracism on antisemitism. Cameron quoted Smith as lamenting that the Birchers “not only do not discuss the Jewish issue but once in a while they are tempted to bite a little flesh out of some of us who have dared to discuss the Jewish issue.”
Despite Welch’s refusal to cross the line of open antisemitism, Cameron nevertheless saw these connections as profoundly troubling. He declared that “[t]hus we have evidence that the parasites of religious and racial prejudice are crawling into bed with the John Birch Society”. He added, “I shudder to think of the hideous offspring of such a mating.”
With the toxicity of the John Birch Society magnified, Cameron warned that society continued to use its influence to shape policy and governance. Cameron’s target of choice was the Americans for Constitutional Action (ACA) and their access to members of Congress. He asserted that half of the ACA leadership were members of the John Birch Society and that the ACA maintained numerous other financial connections with the society. He stated that the ACA attached itself “like a political leech” to Congress and could “transfer the image of respectable conservatism to radical rightwing extremism.” Throughout the rest of his speech, he called out the identities of alleged Birchers, including several prominent Old Right noninterventionists and members of the Citizen’s Foreign Aid Committee (CFAC). Among the names mentioned by Cameron were the “enthusiastic Bircher,” former congressman Howard Buffet and CFAC member General Bonner Fellers. He also noted that the ACA distributed materials from the “reactionary” Dan Smoot.
To cap off his speech, Cameron invoked the recent history of Europe’s experiences with totalitarianism. He warned that while the danger of such organizations was minimal during regular times, he caveated this by asserting Americans were enduring an environment perilously close to those which ushered in communism and Nazism. For him, the Cold War constituted “a crisis” that could empower those with “extremist panaceas [to] become a real threat to democracy.” While Cameron did not explicitly claim that groups like the John Birch Society were plotting a fascist takeover of the U.S., his speech did much to connect their” extremism” and the eventual destruction of the American way of life.
Cameron’s speech was proliferated by the Associated Press and republished in local newspapers in his home state of California and throughout the country. The speech was also reprinted via the Congressional Printing office and distributed by Birch-watchers. A copy of Cameron’s address is located in the papers of Bryan W. Stevens, a noted Birch reporter; it was in Stevens’s papers where I initially encountered the speech.
Its destination serves as proof of its intent to serve as a means of political propaganda. To be fair, the printed congressional speech was a typical political messaging tactic in the days before the internet, one that the right also engaged in. The scheme often worked one of two ways. First, a political figure would deliver an address, sometimes in conjunction with an outside, nominally independent political organization. Then, said the organization would pay to print copies of the speech (portions of the Congressional Record could not be printed at taxpayer expense). Printed copies would then be circulated through mailing lists, handed out at events, etc. Conversely, political groups would often write ideologically aligned congressional members and ask them to enter a written item into the Congressional Record and then provide the funds to print it.
Either way, the relationship added a veneer of state authority to a partisan political goal. And such is the case with Cameron’s speech, with its title “Who is Doing the Devil’s Work in American Politics?” emblazoned upon an official government document (see below).
Page one of the printed version of Rep. Cameron’s address. Note the provocative title prominently depicted beneath the authoritative congressional masthead. Source: Stevens, Bryan W. The John Birch Society in California politics, 1966: by Bryan W. Stevens. The Publius Society, c 1966. Political Extremism and Radicalism, link.gale.com/apps/doc/RAICBF251389805/PLEX?u=viva_gmu&sid=bookmark-PLEX&xid=370d8729&pg=183. Accessed 3 Feb. 2022
And what was the political goal? To use the John Birch Society (JBS) as a bludgeon to be used against the conservative movement writ large. By 1963, the JBS was clearly serving that function for Cold War liberals and progressives. And to be fair, the society and its leader, Robert B. Welch, did not do themselves many favors. From Welch’s insinuation that Eisenhower was a commie, to their generous use of the “communist” label, to some of their more outlandish conspiracist claims, the JBS and Welch gave their detractors plenty of rope to hang themselves with. However, despite these angles of attack, the group’s eccentricities were not enough to make them uniquely toxic.
Despite the labels applied to them, the Birchers embodied a then-declining bourgeois Americanist social order at odds with the ascending postwar managerial state. The society was considerably more antielite and often antistatist than attacks leveled upon them would otherwise suggest. They similarly embraced a view of economic relations and a conspiratorial view of history that, while in 1963 was considered “extreme,” would have seemed banal or downright ordinary 30 years prior. And thus, as during the First Brown Scare, the JBS’ ideological proximity to other, more objectively and explicitly illiberal or antisemitic organizations was used by their opponents to achieve their political ends. The group’s real and imagined proximity to odious actors like Gerald L. K. Smith became essential for the political attacks against them. Despite the admitted distance between Smith and Welch, their shared anti-elitism and the occasional rightward drift of some former Birchers was enough to rope the two groups together.
In this formulation, we see one example of a common adjacency attack meant to shrink the political coalition of one’s political opponents. In 1963, Smith and his publication had no political clout. However, the Birchers did. Therefore, Smith and co. became the ammunition used to make the JBS even more radioactive than they were on their own. Once completed, the society was then used as a weapon against other political targets further inside the Overton Window. Conservative power brokers like William F. Buckley then furthered the process along and exiled the society and, as a result, aided liberals in moving the Overton Window ever leftward (see my crude graphic below).
This graphic depicts the relationship between different ideological parties as it relates to an outside political force and their attempts to control the political discourse of their opponents. The “weapon,” in this case, the John Birch Society, stood astride the rightward edge of the Overton Window. Their opponents used their proximity, real and exaggerated, to make them a radioactive bludgeon, which could then be used to discipline “the Target,” the rest of the political right.
This three-degree tactic is, of course, not limited to the left. The right, for a time during the McCarthy era, used the same approach to varying degrees of success, and indeed even the Birchers themselves tried to do the same to their opponents. The difference, however, is that after the inglorious end to the career of Tail gunner Joe, McCarthyite became a slur; no such pejorative exists to describe the reverse. “Cameronite” isn’t a thing.
And it isn’t a thing because the Birchers and other targets of the Second Brown Scare are not traditionally treated as sympathetic characters due to their opposition to key components of the modern liberal program, chiefly Civil Rights. Despite a brief period of nuance in the 1990s and early 2000s, the historiography of these events has reverted back to a narrative largely resembling that of Cameron’s speech. The double whammy of Brexit and Trump has provided incentives to justify current moral and political panics but resuscitate those of yesteryear.
[i] According to the data analysis I have conducted for this project, Rep Cameron’s opposition rate to U.S. foreign policy during his four-year congressional career (1963-1967) was a mere 7%, a statistic of note given Cameron’s politics and political targets.
Like a lot of veterans of Operation Enduring Freedom, I have been trying to process the collapse of the Afghan government and the return to power of the Taliban. As a historian (if I may be so bold as to call myself one) I understand that war is immensely complicated, and the reality of war never aligns neatly with the narratives which are formed for and by them
It has been tough. “What a waste” has been playing over and over in my head. I grew disillusioned with the war during my second string of deployments eight years ago, so I was somewhat prepared for this. But I didn’t think the collapse would be so quick and so catastrophic nor was I prepared for the human cost of our failure. All the lives lost, all the money spent, all the time wasted, and it was all for nothing. At the risk of sounding like a narcissist, I wrapped up the best years of my life in the war. I was 18 and in basic training on 9-11. I turned 21 at Bagram. I turned 30 in Kandahar. I spent six of the first 12 months of my relationship with my now wife deployed to Afghanistan. I’m glad that I came out alive and intact, but I cannot help but to ask, what was that all for?
I feel immense sorrow at times. During my first deployment, 2004-2005 there wasn’t much of a war to speak of. Young, dumb, and full of testosterone we were all bummed by this. We wanted action. We wanted revenge for 9-11. Thankfully and in hindsight, we didn’t see much action, despite being an infantry unit. Most of the time things felt like a peacekeeping mission. What violence existed was confined to the heavily Pashtun areas and small in scale. The kids would all wave and yell tashakkuri, “thank you” in Pashto. Few women in the cities wore burkas. In this little town named Janda, I remember walking to the local roadside shop for cigarettes, soda, and bolani without body armor and while lightly armed…it was safer than some spots in D.C.
And now all that peace is gone. Was that merely a lull? A mirage? I don’t know, I suppose that will be up to us historians to sort out. By my second wave of deployments (2010-2013), Janda had become a hotbed of Taliban activity. I helped to capture a Taliban commander who was living in Janda…coincidently, I had photos of his house taken during my leisurely jaunts eight years prior. It was a puzzling juxtaposition of progress lost.
I was perplexed by all this. It didn’t comport to the cartoon narrative I was indoctrinated with nor my liberal faith. Then I read report after report concerning the Taliban’s rural revival. In almost every instance, the impetus was the same. Just as in the mid-’90s, the locals wanted courts to mediate disputes, and security to stop the lawlessness. However brutal, the Taliban was preferable to bedlam and banditry. Nor did they want a western-backed government that was seen as corrupt and distant. And, of course, coercion was ever at play. It is hard to be brave and fight when the Taliban will kill your family, burn your house down, and chop your head off if you resisted…which they did.
I tried to remain stoic in my duties. However, I’d be lying if I said that I didn’t take a little pleasure in sending those kinds of people to hell.
It was clear to me by 2013 that there was no winning the war and that it was being waged surrounded by rampant waste, fraud, and abuse, at all levels and by our government and by our Afghan allies. My disillusionment with the war foreshadowed my political transformation to the libertarian right. I came to realize that no amount of American blood or treasure, no amount of central planning or support was going to prop up the Afghan government. President Biden was right…it was time to go.
Even if the war was ill-advised from the start, unjust, unwise, or we merely stayed too long, I am having a hard time coming to grips with how it ended. The tragedy of it all is just too difficult to conceptualize. I am thankful that my boy is only two because I don’t know how I would explain to him that sometimes the bad guys win.
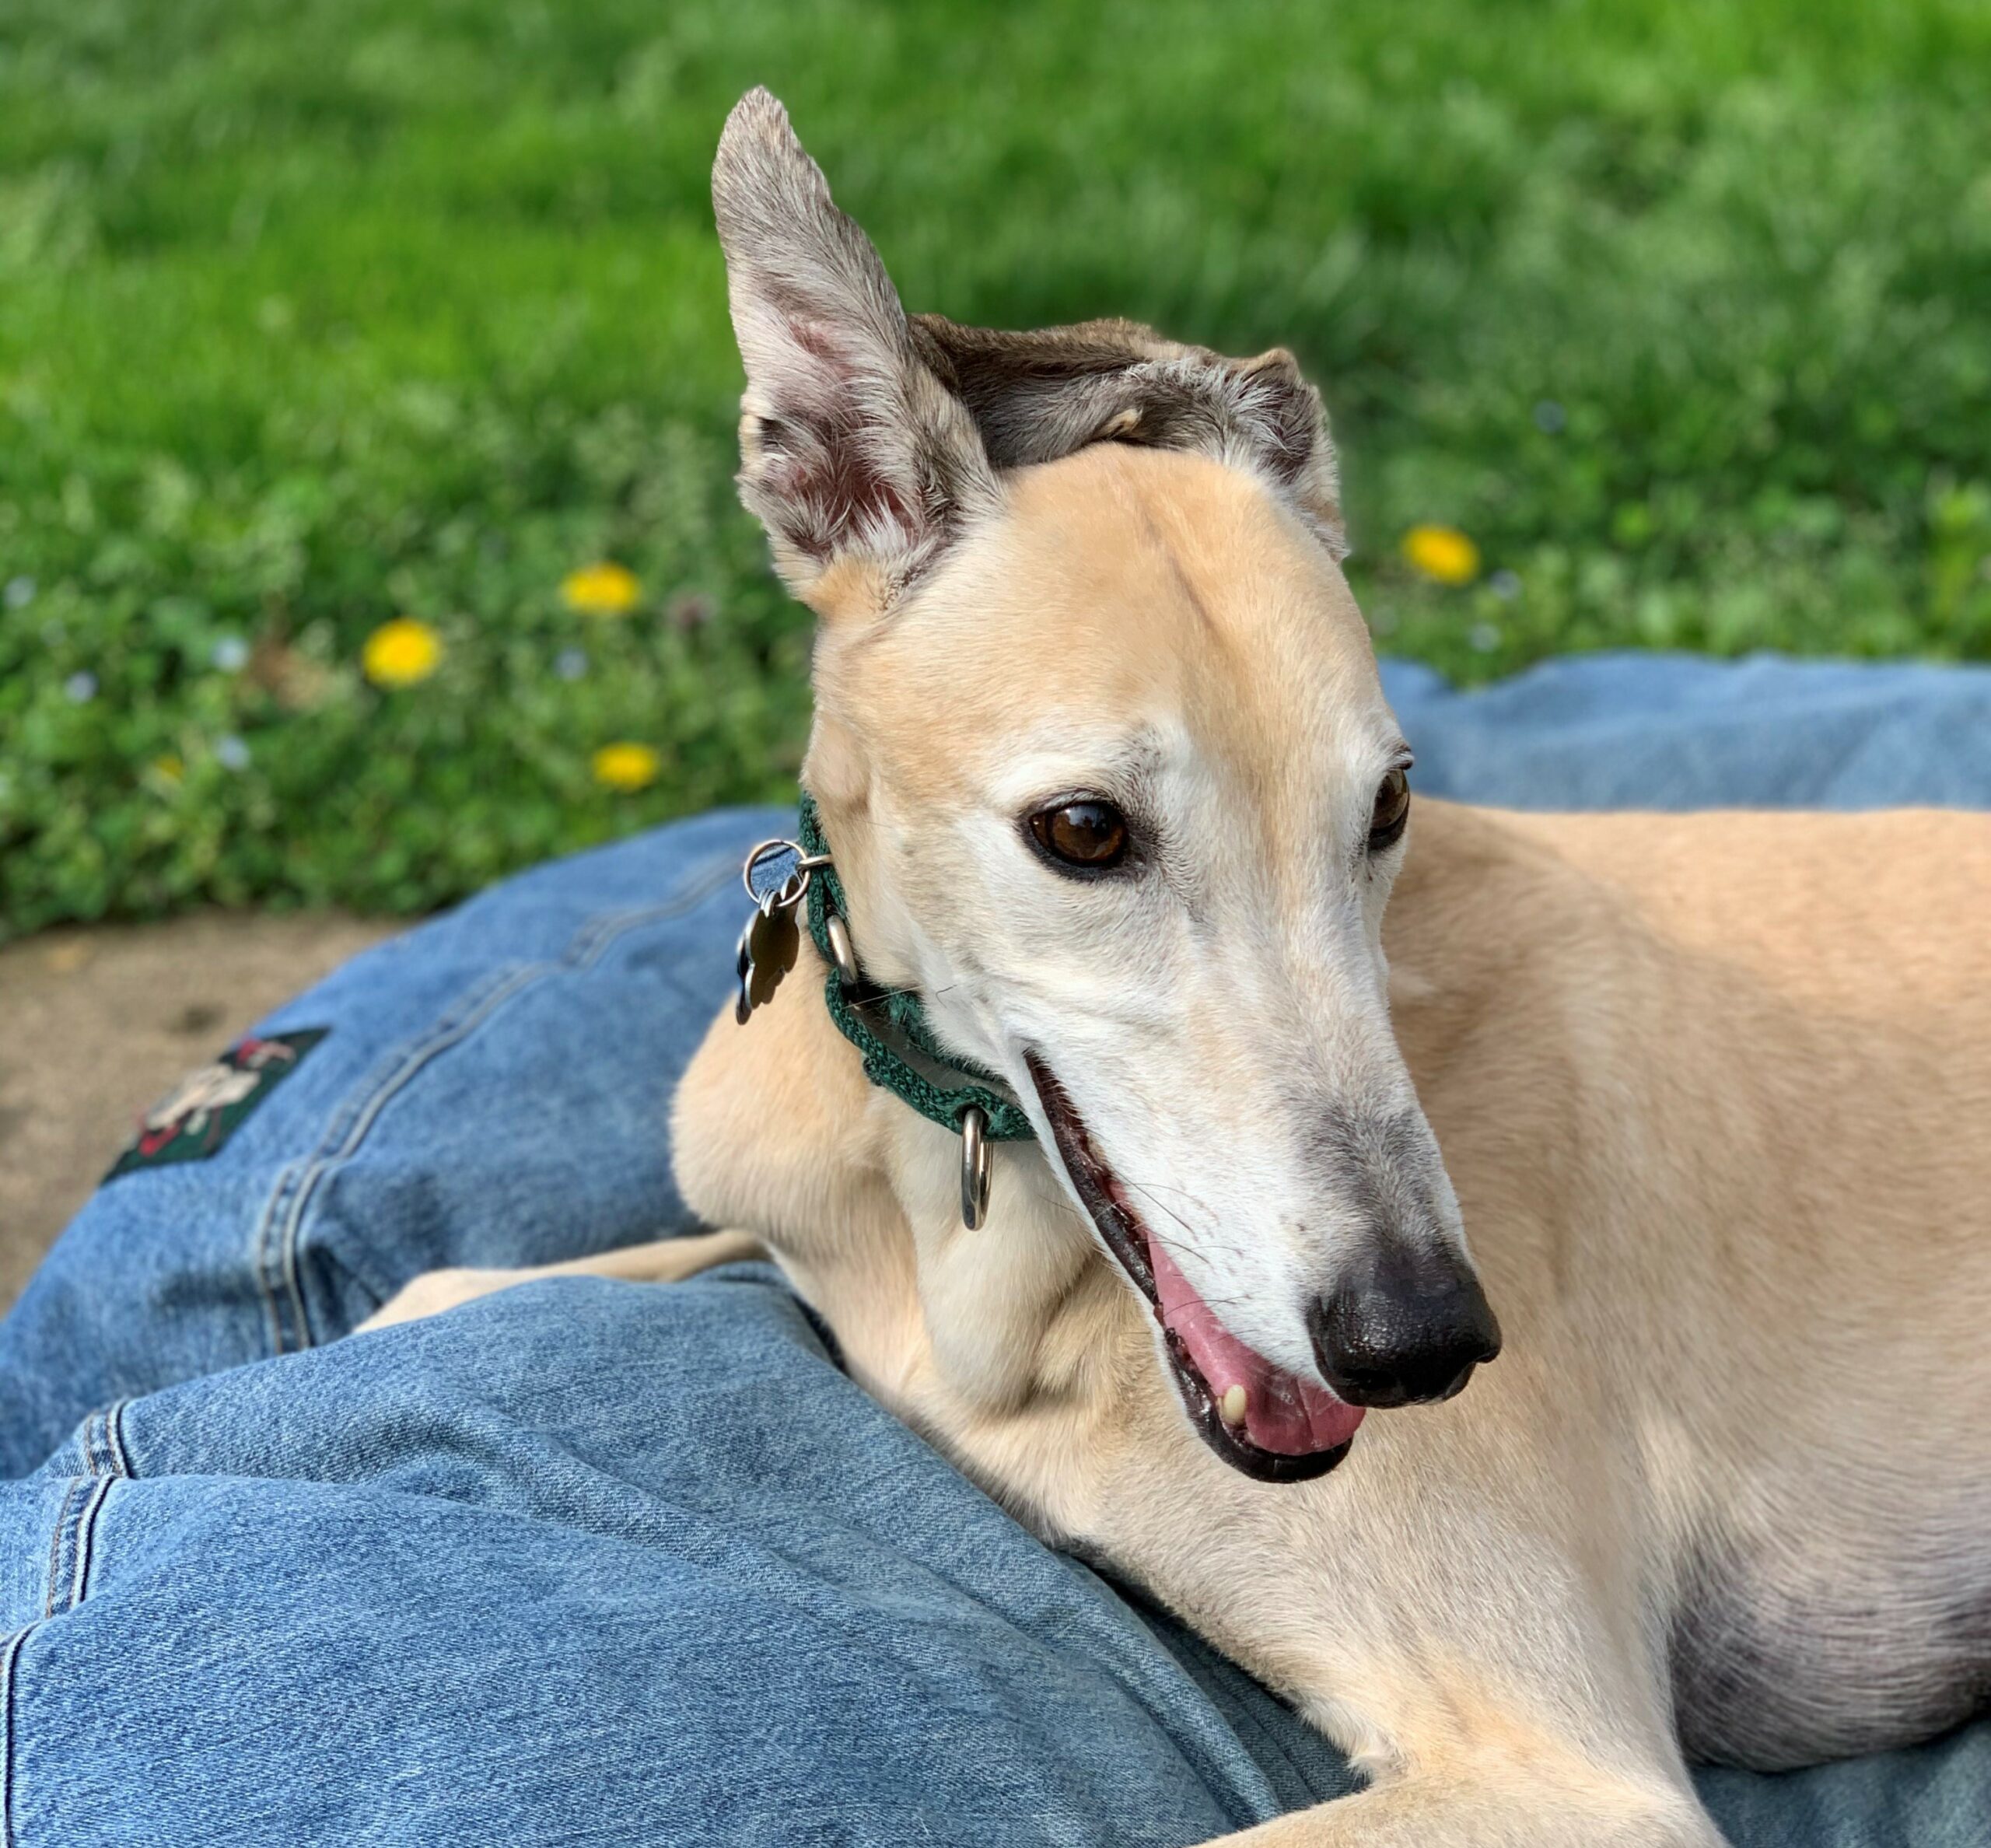
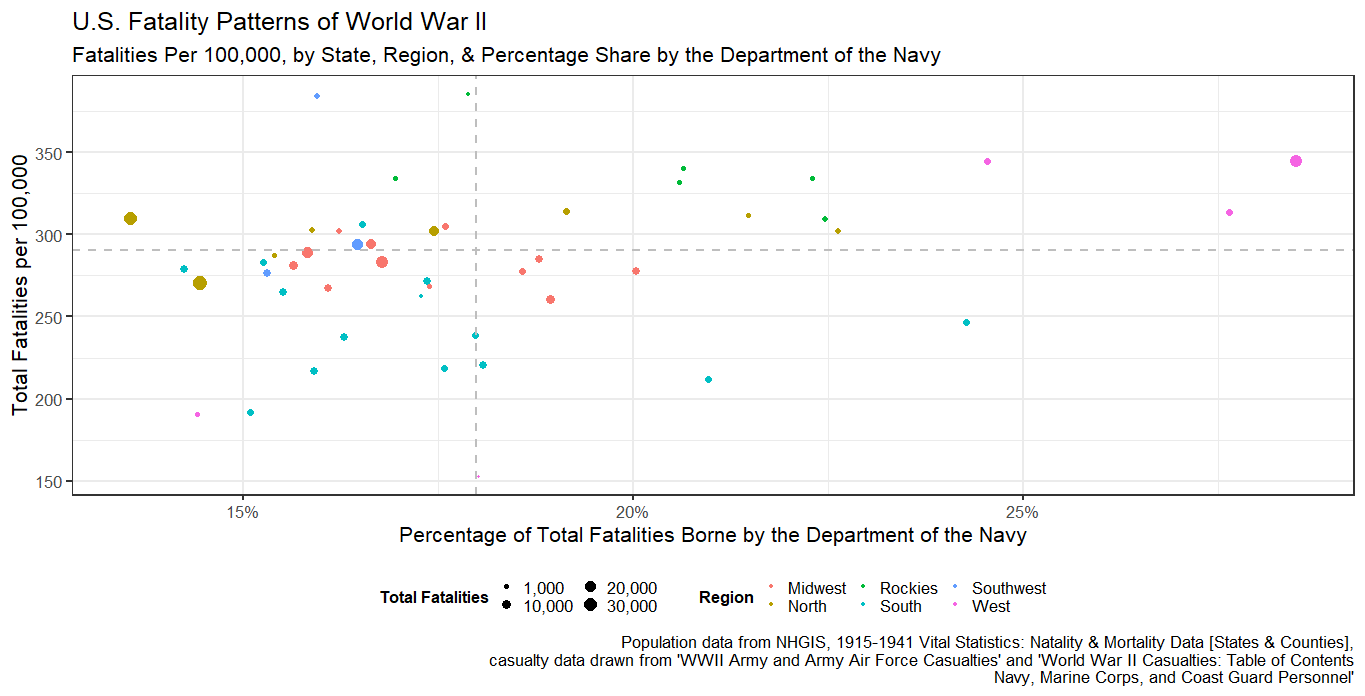
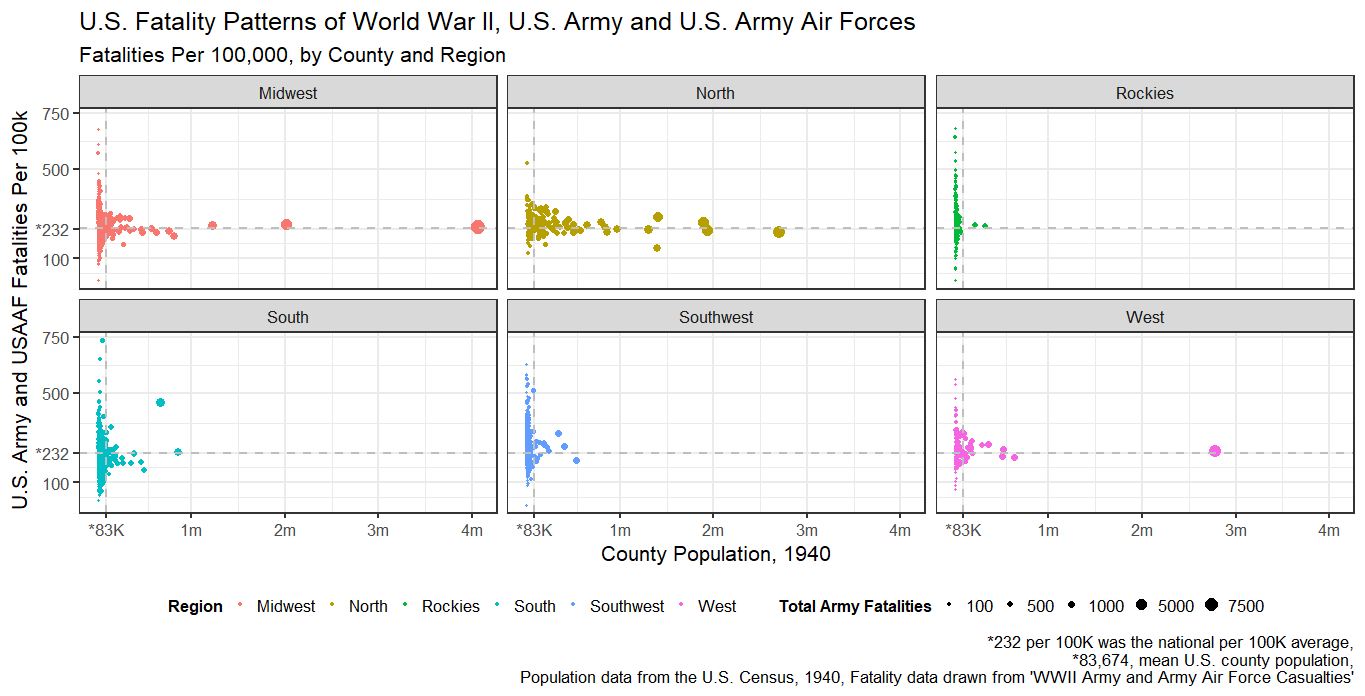
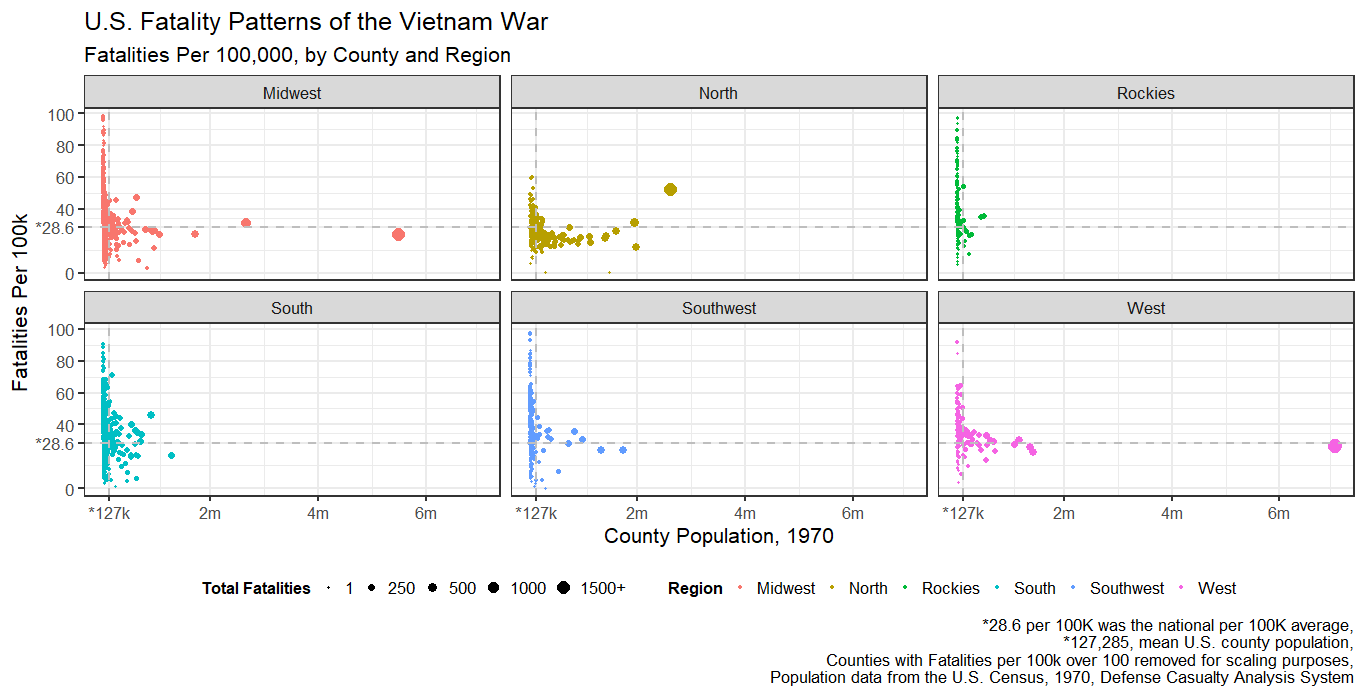
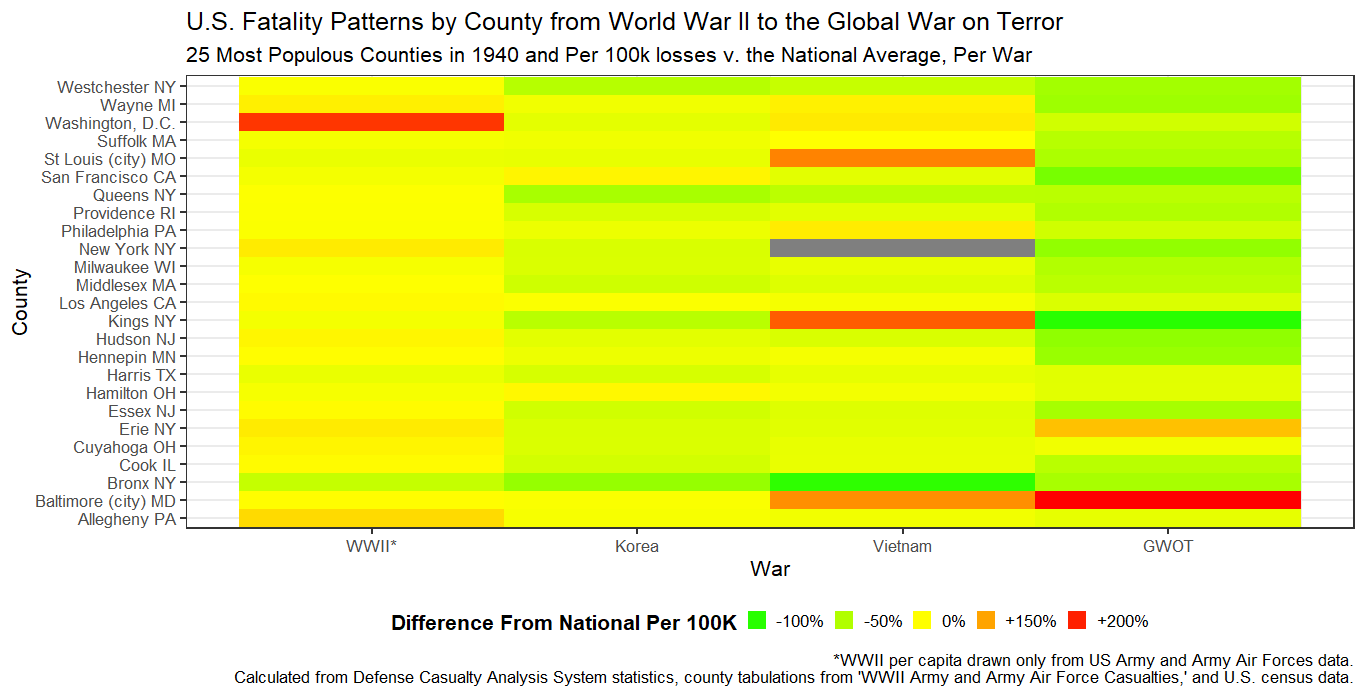
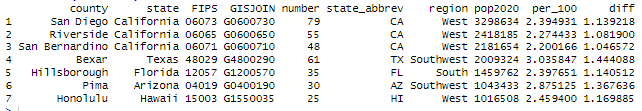
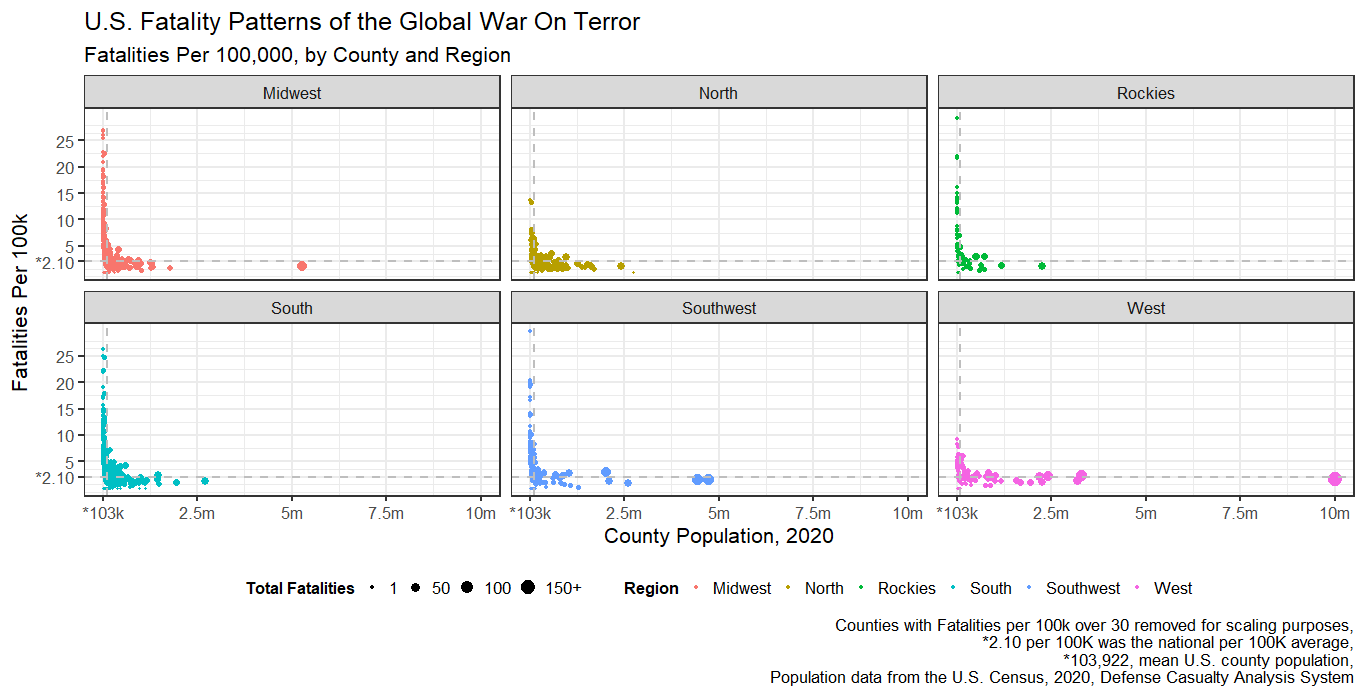
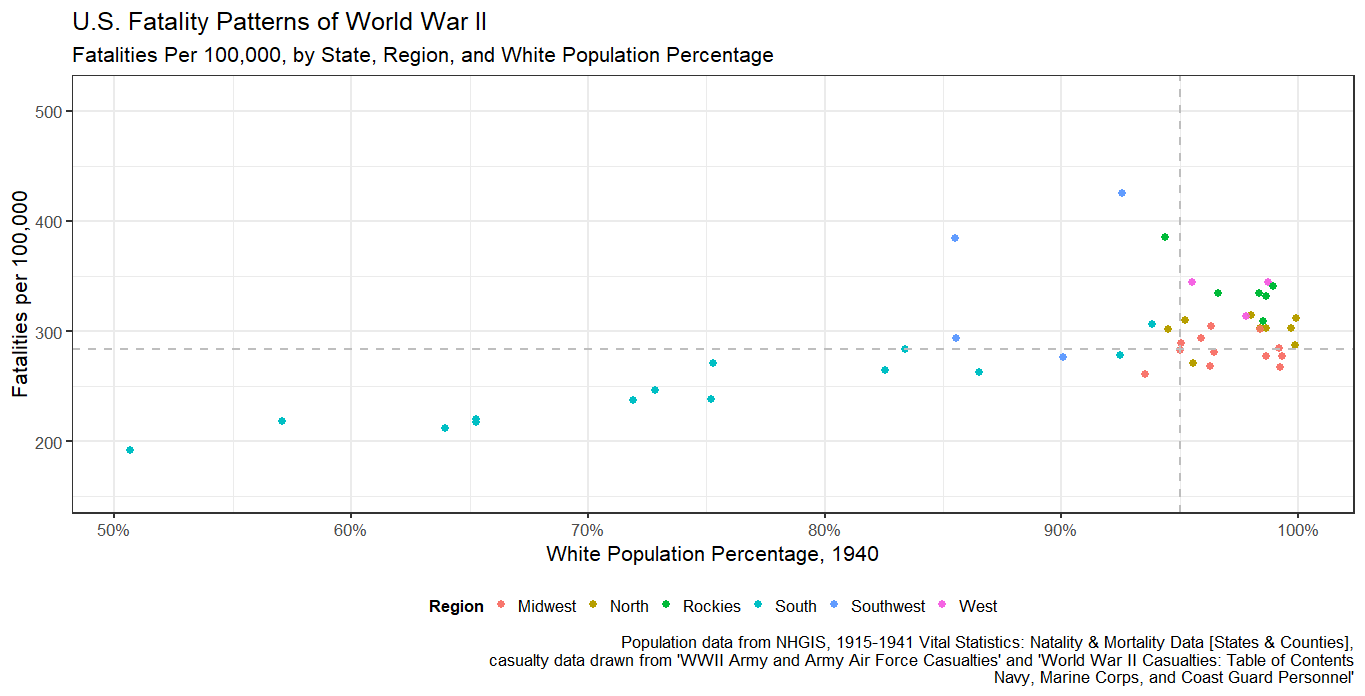
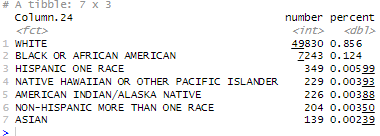
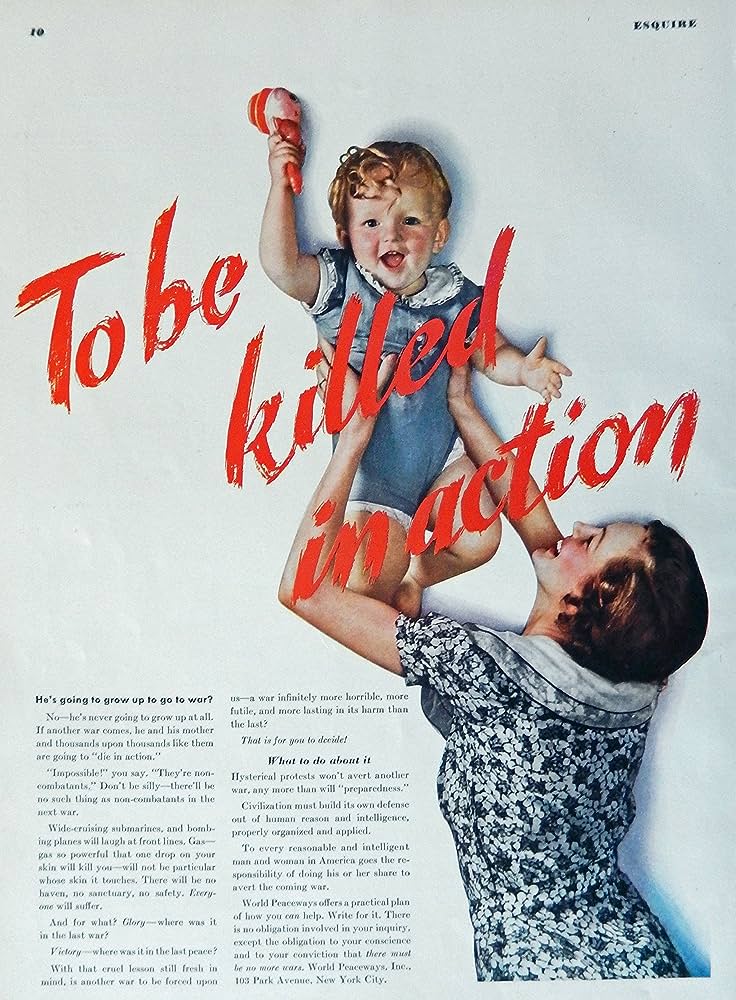
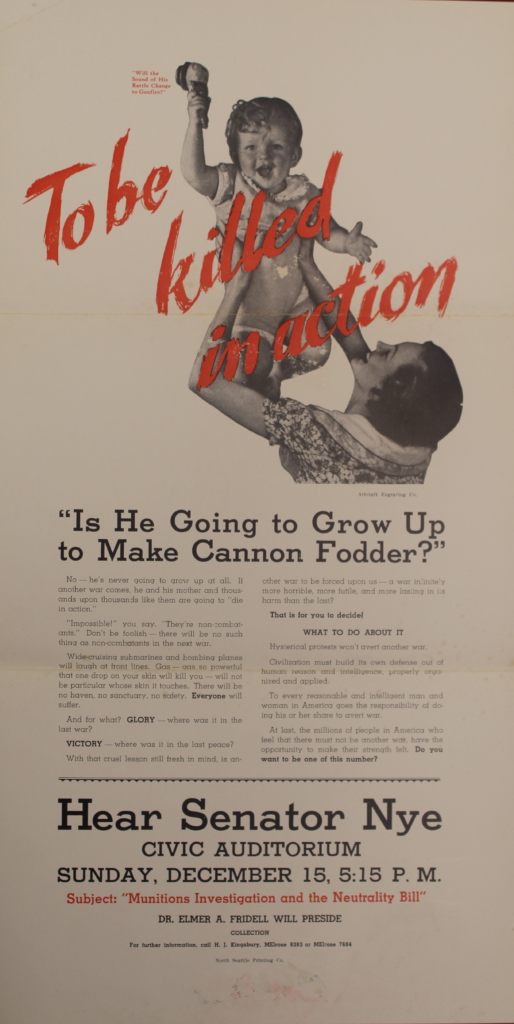
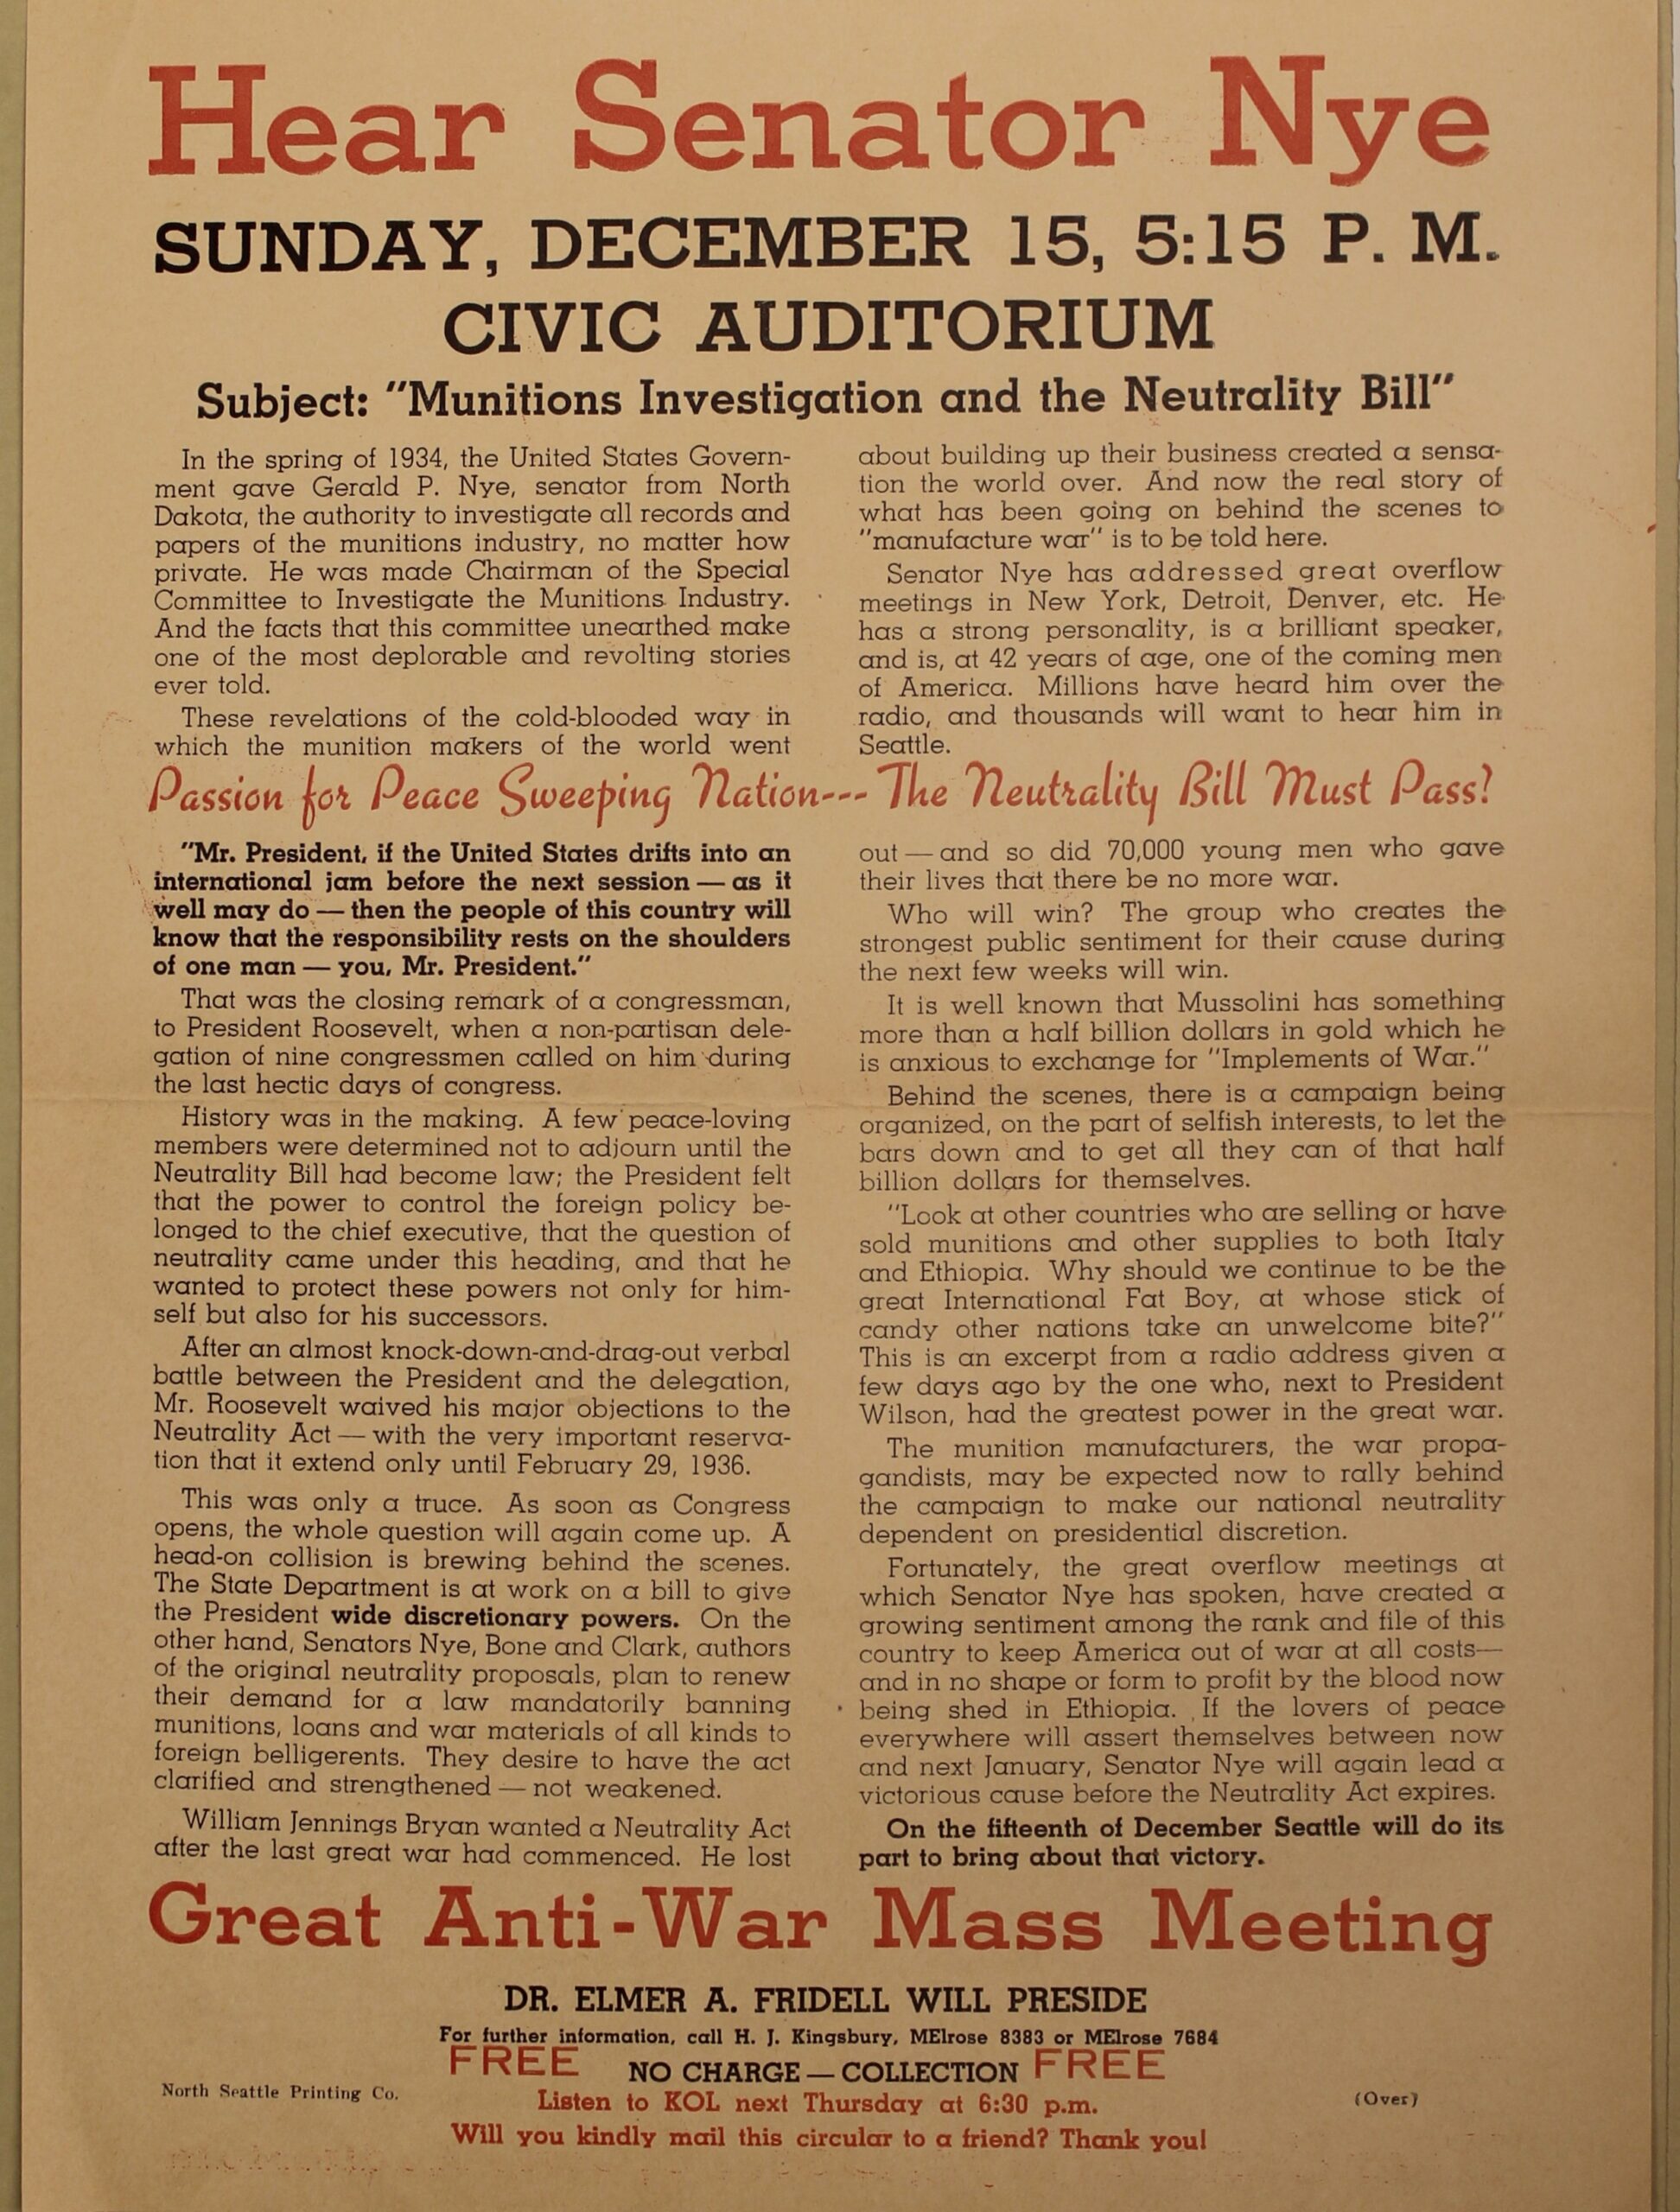
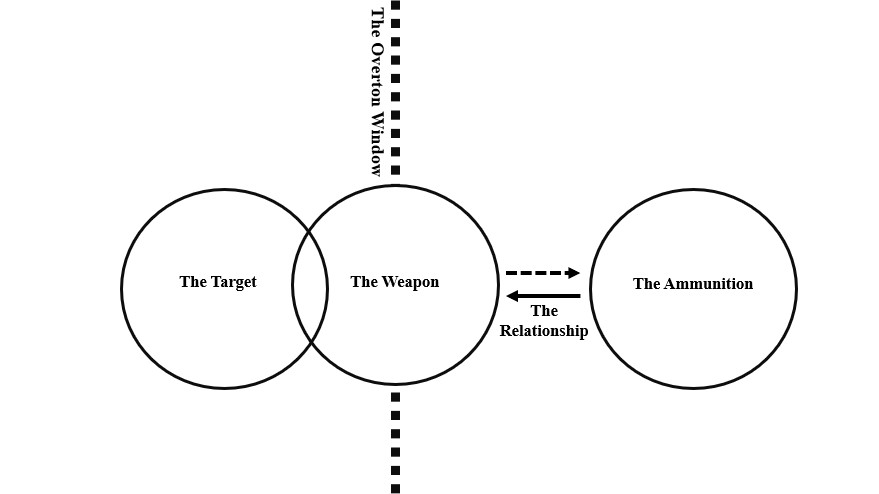