I’m pleased to share that Responsible Statecraft published my latest article on the historical debates about the U.S. commitment to NATO and European security. It argues that the reciprocal outrage of Trump’s comments and the ensuing media response has obscured long-standing historical debates about Americans’ relationship to the Old World. Give it a read:
Thanks to the Libertarian Institute for publishing my latest article, “Enemies Above: The FBI and the Creation of the Brown Scare Myth.” It highlights the role of the Federal Bureau of Investigation in propagating the “Brown Scare,” and its implications for modern politics.
A special thanks to Kelley Vlahos and Responible Statecraft for publishing my latest. The piece places the Twitter Files revelations and greater concerns about government-big tech collusion within the historical context of the American information state. The article illustrates that the U.S. government has a long history of manipulating media for the purposes of steering public opinion on foreign policy. The piece also argues that media attitudes about the practice have evolved from outrage to apathay to active involvement.
A special thanks to the Libertarian Institute for publishing my latest, “Brown Scare, Red Scare, Fake Scare, Who’s Scared?”
It is a brief history of the “scare cycle,” the reciprocal political purges between the Left and the Right. It argues that these scares, built upon exaggerated claims of nefarious foreign influence, have narrowed the Overton Window on America’s role in the world, thereby maintaining a belligerent foreign policy.
Special thanks to the Libertarian Institute for publishing my latest piece, ‘Power Elite Analysis: Lessons from the ‘Conspiracist’ Right and New Left Academics.’ It covers some of the New Left – Old Right ideological cross-pollination of the late 1960s and argues the example set by one New Left scholar, G. William Domhoff, is one that we ought to aspire to.
Thanks to Kelley Vlahos and Responsible Statecraft for publishing my latest article! It juxtaposes the Korean War with the Ukraine Crisis and argues that the latter will continue to undo the foreign policy consensus forged by the former.
The folks at freethepeople.org were nice enough to publish my latest op-ed: “Why Can’t We Be Friends? The History of and Prospects for Left and Right Antiwar Collaboration.” It argues that today’s antiwar political environment resembles that of the late Interwar Period. Furthermore, it argues that today’s antiwar movements have a historic opportunity for collaboration as they are unlikely to be driven apart from establishment narratives about America’s role in the world.
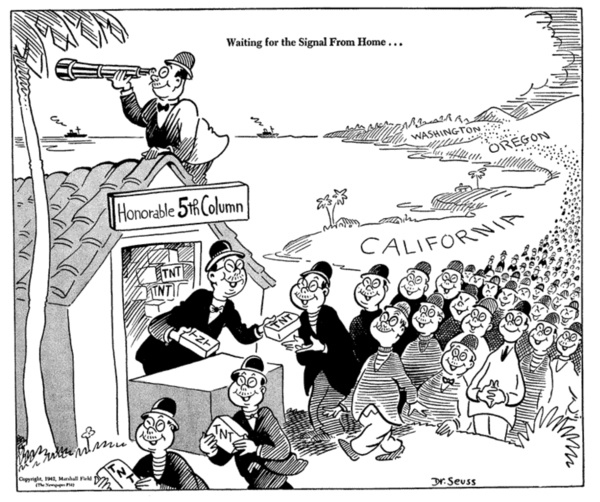
In today’s climate of war fever and paranoia, Francis MacDonnell’s Insidious Foes: The Axis Fifth Column and the American Home Front ought to be essential reading for any well-meaning person who wants to prevent the errors of the past. For all the comparisons between Hitler and Putin, the domestic climate of fear is a closer analog to the late 1930s than to the ambiguous state of Russian forces that invaded Ukraine. Similarly, the domestic costs of confrontation with Russia will have a far more significant impact on the lives and livelihoods of Americans than whatever resolution might tragically befall the people of Ukraine.
Temperamentally, I am the sort of historian (if I may be so bold as to call myself one) who believes that history ought to, at best, be used as an instrument of caution, not a tool for action. In that vein, Insidious Foes has immense value. MacDonnell’s work explores America’s domestic worries about an Axis “fifth column” from 1938 to 1942. While not baseless, MacDonnell argues that these worries were exacerbated by government and media forces into a kind of moral panic. MacDonnell asserts, “[t]he Axis Fifth Column scare thus fits into a historical pattern of national hysteria (p.4).”
While MacDonnell doesn’t discount the presence Nazi sympathizers on American shores, or real Nazi agents, he argues that these threats were marginal. While demagogues like Father Caughlin or American Bund inspired individual acts of violence, they “never posed any real threat to the republic (p.47).” He further asserts that “[t]hroughout the Great Depression Americans demonstrated antipathy toward both right-wing and left-wing radicalism.” And as for actual Nazi agents, plots hatched by German intelligence were woefully inept and quickly foiled. Despite these realities, the domestic threat of fascism was seized upon by the government and mass media for their ends. This distance between image and reality should serve as a warning in this time of foreign war, as both the government and the corporate press are interested in amplifying Putin’s threat abroad and at home.
And if you’re still with me thus far and have difficulty accepting the validity of these arguments because your politics may not align with mine, let me appeal to your egalitarianism and your self-interest. MacDonnell illustrates that the tragedy of Japanese internment was made possible by the fear of domestic fascism, a fear stoaked by the government and media. MacDonnell asserts, “the panic’s intensity greatly agitated the public and made possible the tragedy of internment (p.90).” Will Russian nationals and Americans of Russian descent likely be rounded up and thrown in camps in 2022? No. However, Russophobia exists and, I would even argue, is tolerated in this climate. Are we that much more advanced than the Americans of the late-1930s? We can be better than these base instincts if we allow history to serve as a warning.
And now, for your self-interest. MacDonnell argues the domestic fear of fascism and the resulting victory over Hitler accelerated the “creation of a powerful intelligence establishment at home (p.9).” The fear surrounding the fascist threat helped to solidify the national security state and was subsequently and concurrently against dissentients on the left. The “Brown Scare” of the late 1930s helped birth the “Red Scare” of the 1950s. Whatever happens in Europe, you can bet the farm that some unscrupulous actors here at home will want to use the threat of Putin to expand the national security state.
Perhaps that might even sound appealing! But remember that these powers can be turned against you and the political causes you support. And, if history is any guide, it will be.
It is clear for anyone unfortunate enough to be on Twitter that the Russian invasion of Ukraine has further inflamed the American political divide and the culture war. Twitter’s “What’s Happening” panel is awash in hashtags like #GOPTraitors#GOPTraitorsToDemocracy #GOPtheRussianParty. These hashtags and many others reveal an accelerating liberal narrative about the Republican Party. It is difficult to know how much of this sentiment is earnest v. bot-driven; however, either way, such narratives miss the make when explaining the right’s turn towards noninterventionism.
These myopic narratives are missing the more considerable evolution within the American right Republican Party’s base that has wavered on U.S. foreign policy, not merely because of some affinity for Putinism, nor due to “Russian disinformation.” They’ve wavered in their support due to the sacrifices borne from 20 years of war. I am not the first person to make this argument, and I previously did so in a piece for antiwar.com. Given the virulence and short-sightedness of his discourse, I believe that this topic demands to be revisited.
While it is true that some segments of the dissident right hold fundamentally illiberal political views and have an affinity for postliberal politics, assigning this as a primary reason for the right’s newfound “isolationism” mixes cause and effect.
In addition to more generalized populism, such politics have appeal because of the failures of the neoliberal political consensus. On issues of trade, immigration, and war, this consensus has failed to live up to its lofty goals and promises. Among these failures are the societal and economic impacts of the Global War on Terror. Populists are speaking to (and capitalizing on) these concerns as establishment politicians from both parties appear disinclined to do so.
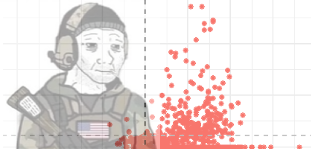
The modern political seeds of this realignment started with the Tea Party. While the right has a long history with “isolationism,” it was a cadre of young House members and Senators who led the opposition against the wars in Libya and Syria. As the War on Terror grew under the Democratic Obama administration, right-wing resistance to American interventionism became primed for a figure like Trump to capitalize on their discontent. Scholars Douglas L. Kriner and Francis X. Shen have argued that disparities in military deaths gave Trump an edge in his 2016 win in crucial swing states, particularly in the Midwest.
The graphic depicts the relationship between Trump’s 2016 election performance and John McCain as compared to per capita military fatalities. Each dot represents a county and is colorized and faceted by country region—each dot is located on an x-axis which depicts the difference in vote share between Trump and McCain. The y-axis shows each county’s 1 per 100k per capita causality rate. High per-capita rates of military casualties gave an edge to Trump’s 2016 presidential victory. The relationship becomes clear when comparing the electoral results between Trump and Sen. John McCain, the embodiment of the conservative establishment. Many Trump voters supported the political novice due to his noninterventionist musings and condemnation of the Iraq War, an unusual position for a Republican political figure.
county
state
Median Household Income
Total Pop
No. of Fatalities
Fatalities per 100k
08 McCain Vote %
16 Trump Vote %
Trump Gain
Garfield
Montana
43106
1192
1
83.9
82%
91%
9%
Haakon
South Dakota
50747
1924
1
52.0
82%
90%
7%
Edwards
Texas
40424
1993
1
50.2
65%
70%
5%
Oldham
Texas
59404
2054
1
48.7
88%
90%
1%
Sanborn
South Dakota
56507
2352
1
42.5
57%
73%
16%
Kiowa
Kansas
49588
2570
1
38.9
80%
83%
3%
Big Stone
Minnesota
52692
5264
2
38.0
46%
58%
13%
Hutchinson
South Dakota
59336
7343
2
27.2
64%
75%
11%
Clark
South Dakota
54158
3686
1
27.1
55%
69%
13%
Mason
Texas
54914
4022
1
24.9
73%
81%
8%
Red Lake
Minnesota
58384
4075
1
24.5
45%
61%
16%
Sutton
Texas
63427
4080
1
24.5
75%
76%
1%
Knox
Missouri
41755
4133
1
24.2
60%
76%
16%
Richardson
Nebraska
50207
8350
2
24.0
59%
73%
14%
Florence
Wisconsin
58270
4397
1
22.7
56%
71%
15%
Oceana
Michigan
52319
26513
6
22.6
47%
61%
14%
Mineral
Nevada
43771
4768
1
21.0
49%
59%
10%
Hot Springs
Wyoming
52344
4803
1
20.8
72%
75%
3%
Linn
Kansas
62876
9640
2
20.7
67%
79%
12%
Martin
Texas
68745
4825
1
20.7
81%
83%
2%
Schley
Georgia
51129
5010
1
20.0
72%
77%
5%
Allendale
South Carolina
32147
10351
2
19.3
24%
22%
-2%
Dewey
South Dakota
47640
5336
1
18.7
33%
42%
9%
Wheeler
Texas
58544
5407
1
18.5
85%
91%
5%
Sheridan
Nebraska
46159
5452
1
18.3
79%
85%
6%
Boone
Nebraska
58204
5500
1
18.2
72%
79%
7%
Cherry
Nebraska
50677
5717
1
17.5
77%
84%
7%
Warren
Georgia
37313
5804
1
17.2
41%
42%
2%
Duval
Texas
37100
11739
2
17.0
24%
32%
7%
Dixon
Nebraska
57324
6003
1
16.7
64%
73%
9%
Crosby
Texas
38871
6059
1
16.5
64%
68%
5%
Teton
Montana
54458
6081
1
16.4
57%
68%
11%
Cedar
Iowa
71029
18501
3
16.2
44%
55%
11%
Mckenzie
North Dakota
86890
6415
1
15.6
64%
79%
14%
Morris
Texas
43304
12918
2
15.5
60%
69%
9%
Blaine
Montana
44090
6507
1
15.4
38%
47%
9%
Greenwood
Kansas
44876
6677
1
15.0
71%
76%
5%
Edwards
Illinois
54930
6729
1
14.9
64%
83%
19%
Pershing
Nevada
58562
6751
1
14.8
59%
71%
12%
Ontonagon
Michigan
45531
6756
1
14.8
47%
60%
13%
Clinch
Georgia
42928
6800
1
14.7
62%
70%
8%
Cumberland
Kentucky
34897
6850
1
14.6
74%
82%
8%
Treutlen
Georgia
37478
6876
1
14.5
62%
67%
5%
Anderson
Kentucky
61308
21465
3
14.0
65%
72%
7%
Weston
Wyoming
59410
7182
1
13.9
77%
86%
9%
Mississippi
Missouri
36802
14390
2
13.9
57%
70%
13%
Nemaha
Nebraska
55343
7258
1
13.8
61%
67%
6%
Lake
Colorado
56850
7287
1
13.7
36%
40%
4%
Rusk
Wisconsin
49860
14715
2
13.6
45%
64%
20%
Valley
Montana
51869
7359
1
13.6
48%
69%
21%
Overton
Tennessee
43636
22086
3
13.6
56%
74%
18%
Fulton
Pennsylvania
56357
14852
2
13.5
74%
84%
10%
Fremont
Iowa
60498
7432
1
13.5
51%
67%
16%
Hempstead
Arkansas
40867
22620
3
13.3
58%
62%
4%
Barnwell
South Carolina
36675
22630
3
13.3
49%
52%
3%
Choctaw
Oklahoma
37131
15225
2
13.1
67%
78%
11%
Lee
Kentucky
30905
7874
1
12.7
71%
81%
9%
Marshall
Oklahoma
45005
15887
2
12.6
69%
77%
7%
Doniphan
Kansas
52596
7950
1
12.6
67%
77%
11%
Richland
Illinois
49775
16215
2
12.3
57%
75%
18%
Castro
Texas
51736
8110
1
12.3
68%
71%
3%
Richland
North Dakota
62837
16342
2
12.2
52%
63%
11%
Doddridge
West Virginia
50642
8201
1
12.2
73%
83%
10%
Kit Carson
Colorado
42951
8276
1
12.1
71%
80%
9%
Newton
Arkansas
37648
8334
1
12.0
65%
77%
11%
Keith
Nebraska
51478
8367
1
12.0
74%
80%
6%
Gilchrist
Florida
46171
16956
2
11.8
72%
80%
8%
Oscoda
Michigan
44594
8609
1
11.6
54%
70%
16%
Platte
Wyoming
57425
8673
1
11.5
65%
76%
11%
Prairie
Arkansas
46205
8696
1
11.5
66%
73%
7%
Beadle
South Dakota
51844
17408
2
11.5
53%
66%
13%
Ouachita
Arkansas
46393
26134
3
11.5
54%
54%
-1%
Weakley
Tennessee
42506
35024
4
11.4
65%
74%
9%
Monroe
Missouri
48399
8782
1
11.4
59%
76%
17%
Benton
Indiana
55016
8888
1
11.3
57%
70%
13%
Dawson
Montana
56677
8936
1
11.2
59%
76%
17%
Marion
Mississippi
38402
27083
3
11.1
66%
67%
1%
Archer
Texas
63731
9060
1
11.0
82%
88%
6%
Carroll
Missouri
50628
9296
1
10.8
65%
80%
15%
Greene
Iowa
55562
9335
1
10.7
49%
58%
10%
Clay
West Virginia
41923
9360
1
10.7
54%
77%
24%
Wright
Missouri
39384
18853
2
10.6
68%
83%
15%
Love
Oklahoma
51481
9442
1
10.6
67%
77%
10%
Livingston
Kentucky
50521
9534
1
10.5
63%
77%
14%
Claiborne
Mississippi
31221
9559
1
10.5
14%
13%
-1%
Pickens
Alabama
40249
19705
2
10.1
54%
57%
3%
Cheyenne
Nebraska
56229
9979
1
10.0
74%
78%
4%
Brown
Kansas
47558
9988
1
10.0
68%
72%
4%
Pontotoc
Mississippi
48910
30008
3
10.0
76%
80%
4%
Metcalfe
Kentucky
38978
10109
1
9.9
65%
76%
10%
Caldwell
Louisiana
44007
10119
1
9.9
76%
81%
6%
Ochiltree
Texas
62567
10211
1
9.8
92%
88%
-4%
Kewaunee
Wisconsin
65879
20572
2
9.7
44%
61%
18%
Caledonia
Vermont
50942
31202
3
9.6
37%
39%
2%
Concordia
Louisiana
36276
20806
2
9.6
59%
62%
2%
Kemper
Mississippi
33472
10415
1
9.6
37%
38%
1%
Texas
Oklahoma
56014
20843
2
9.6
85%
80%
-5%
Fulton
Indiana
55011
20844
2
9.6
57%
72%
15%
Runnels
Texas
48650
10530
1
9.5
81%
86%
5%
Stutsman
North Dakota
60297
21110
2
9.5
56%
66%
10%
Lincoln
Washington
60849
10561
1
9.5
64%
72%
8%
Wilkes
Georgia
39716
10590
1
9.4
54%
57%
4%
Switzerland
Indiana
52482
10615
1
9.4
53%
69%
16%
Franklin
Iowa
55847
10683
1
9.4
49%
64%
15%
Mcdonough
Illinois
49048
32609
3
9.2
46%
52%
5%
Alcona
Michigan
41491
10884
1
9.2
53%
68%
15%
Mcduffie
Georgia
44473
21876
2
9.1
57%
59%
2%
Moore
Texas
55099
21990
2
9.1
79%
75%
-3%
Red Willow
Nebraska
50260
11045
1
9.1
74%
82%
8%
Lyon
Kansas
49840
33654
3
8.9
52%
53%
1%
Green
Kentucky
38896
11226
1
8.9
75%
82%
7%
Yankton
South Dakota
60868
22460
2
8.9
51%
59%
8%
Louisa
Iowa
60544
11375
1
8.8
47%
61%
14%
Noxubee
Mississippi
32916
11511
1
8.7
23%
22%
-2%
Lincoln
Oregon
52276
46054
4
8.7
37%
40%
3%
Franklin
Florida
47504
11554
1
8.7
63%
69%
5%
Panola
Mississippi
40655
34700
3
8.6
46%
49%
3%
Mcclain
Oklahoma
75009
34715
3
8.6
76%
78%
2%
Aransas
Texas
53085
23151
2
8.6
68%
74%
5%
Fergus
Montana
48703
11582
1
8.6
66%
73%
7%
Howard
Texas
61112
35003
3
8.6
73%
76%
4%
Starke
Indiana
54001
23372
2
8.6
47%
69%
22%
Ray
Missouri
61678
23474
2
8.5
51%
65%
15%
Carlton
Minnesota
65749
35399
3
8.5
35%
45%
9%
Iron
Michigan
46814
11813
1
8.5
48%
62%
14%
Wabash
Illinois
54249
11914
1
8.4
56%
74%
18%
Cherokee
Iowa
59901
12095
1
8.3
53%
67%
14%
Lawrence
South Dakota
53902
24193
2
8.3
57%
63%
5%
Charlton
Georgia
42891
12137
1
8.2
67%
73%
7%
Boone
Arkansas
50083
36918
3
8.1
68%
76%
8%
Crawford
Missouri
48315
24637
2
8.1
60%
80%
20%
Hickman
Tennessee
46176
24659
2
8.1
56%
73%
17%
Grant
Kentucky
55210
24671
2
8.1
63%
76%
13%
Scotts Bluff
Nebraska
50263
37072
3
8.1
66%
70%
4%
Northampton
Virginia
45235
12388
1
8.1
41%
44%
2%
Grundy
Iowa
73683
12447
1
8.0
58%
66%
8%
Dale
Alabama
45120
50358
4
7.9
72%
74%
2%
Powell
Kentucky
41760
12625
1
7.9
57%
71%
14%
Marshall
Illinois
63628
12629
1
7.9
50%
63%
14%
Butler
Kentucky
46305
12714
1
7.9
70%
79%
10%
Lewis And Clark
Montana
66075
63620
5
7.9
45%
49%
4%
Shelby
Texas
39708
25455
2
7.9
72%
79%
7%
Amelia
Virginia
60096
12729
1
7.9
61%
67%
6%
Adair
Missouri
43044
25607
2
7.8
50%
59%
9%
Pike
Indiana
52378
12831
1
7.8
53%
74%
20%
Grayson
Kentucky
43771
25785
2
7.8
67%
78%
11%
De Kalb
Missouri
53997
12900
1
7.8
62%
77%
15%
Franklin
Kansas
55984
26035
2
7.7
60%
66%
5%
Amite
Mississippi
41575
13110
1
7.6
56%
61%
5%
Uvalde
Texas
44690
26477
2
7.6
52%
54%
2%
Koochiching
Minnesota
52545
13314
1
7.5
44%
56%
13%
Stewart
Tennessee
52177
13350
1
7.5
54%
73%
19%
Allen
Kansas
46690
13354
1
7.5
61%
67%
6%
Pike
Mississippi
35044
40416
3
7.4
48%
49%
1%
Jackson
Kansas
60615
13492
1
7.4
61%
68%
7%
Perquimans
North Carolina
50804
13495
1
7.4
57%
62%
6%
Wilbarger
Texas
42570
13524
1
7.4
73%
77%
4%
Lewis
New York
56599
27072
2
7.4
54%
65%
12%
Elmore
Idaho
47796
27123
2
7.4
67%
68%
1%
Buffalo
Wisconsin
58407
13575
1
7.4
42%
58%
16%
Orleans
Vermont
48826
27231
2
7.3
35%
43%
8%
Colfax
New Mexico
42754
13726
1
7.3
44%
48%
5%
Sumter
Alabama
29209
13744
1
7.3
25%
25%
0%
Armstrong
Pennsylvania
56259
68839
5
7.3
62%
74%
13%
Howard
Indiana
54048
82770
6
7.2
52%
64%
12%
Cannon
Tennessee
52960
13795
1
7.2
61%
75%
15%
Howard
Arkansas
41427
13820
1
7.2
61%
68%
7%
Comanche
Texas
54122
13981
1
7.2
73%
83%
10%
Jackson
Texas
55800
14077
1
7.1
74%
80%
7%
Meade
Kentucky
54946
28664
2
7.0
60%
71%
11%
Trigg
Kentucky
49955
14351
1
7.0
64%
73%
9%
Lincoln
Wisconsin
60728
28720
2
7.0
43%
57%
14%
Fleming
Kentucky
43943
14381
1
7.0
59%
75%
17%
Susquehanna
Pennsylvania
60235
43277
3
6.9
55%
68%
13%
San Miguel
New Mexico
36986
29387
2
6.8
19%
22%
2%
Washington
Illinois
64297
14698
1
6.8
56%
75%
19%
Hall
Nebraska
57371
58814
4
6.8
61%
65%
4%
Pickens
Georgia
66183
29436
2
6.8
78%
83%
5%
Douglas
Wisconsin
55651
44184
3
6.8
33%
43%
10%
Alpena
Michigan
43676
29529
2
6.8
47%
62%
15%
Shelby
Indiana
59798
44391
3
6.8
59%
71%
12%
Caddo
Oklahoma
45755
29665
2
6.7
65%
69%
4%
Andrews
Texas
74918
14833
1
6.7
82%
79%
-3%
San Juan
Utah
49438
14836
1
6.7
51%
49%
-3%
Karnes
Texas
54843
14841
1
6.7
60%
71%
10%
La Salle
Louisiana
51014
14928
1
6.7
85%
89%
3%
Union
Kentucky
49870
15005
1
6.7
52%
76%
24%
Morgan
Ohio
46883
15025
1
6.7
52%
69%
17%
Mills
Iowa
72679
15061
1
6.6
57%
66%
8%
Craig
Oklahoma
42978
15074
1
6.6
65%
74%
9%
Logan
Illinois
53806
30286
2
6.6
58%
66%
8%
Bourbon
Kansas
47452
15172
1
6.6
63%
73%
10%
Gasconade
Missouri
53751
15226
1
6.6
61%
76%
15%
Knox
Ohio
59957
60988
4
6.6
59%
67%
8%
Marshall
Tennessee
58151
30684
2
6.5
60%
71%
12%
Tallahatchie
Mississippi
31915
15346
1
6.5
40%
42%
2%
Wakulla
Florida
58640
30826
2
6.5
62%
68%
7%
Walthall
Mississippi
35465
15416
1
6.5
55%
59%
4%
Clare
Michigan
42480
30927
2
6.5
47%
64%
17%
Alamosa
Colorado
38213
15499
1
6.5
42%
44%
2%
Gooding
Idaho
50205
15503
1
6.5
70%
72%
2%
Macon
Missouri
45717
15581
1
6.4
61%
76%
15%
Renville
Minnesota
59110
15693
1
6.4
49%
64%
16%
Coos
Oregon
49504
63025
4
6.3
50%
57%
7%
Arenac
Michigan
44017
15867
1
6.3
47%
64%
17%
Washburn
Wisconsin
52735
15916
1
6.3
47%
59%
12%
Vermillion
Indiana
50723
16148
1
6.2
42%
65%
23%
Henry
Tennessee
43159
32349
2
6.2
60%
73%
13%
Clark
Illinois
58323
16309
1
6.1
53%
71%
18%
Burleigh
North Dakota
73565
81666
5
6.1
61%
68%
7%
Emmet
Michigan
59456
32691
2
6.1
51%
56%
5%
Gogebic
Michigan
39030
16400
1
6.1
40%
55%
15%
Chaves
New Mexico
43687
65779
4
6.1
62%
63%
2%
Hot Spring
Arkansas
45860
32943
2
6.1
60%
68%
8%
Coos
New Hampshire
49156
32950
2
6.1
40%
51%
11%
Jefferson
New York
53829
116582
7
6.0
52%
57%
5%
Piatt
Illinois
72265
16705
1
6.0
55%
63%
7%
Dallas
Missouri
42389
16762
1
6.0
64%
79%
15%
Clarke
Mississippi
42826
16763
1
6.0
62%
66%
3%
Le Flore
Oklahoma
42378
50520
3
5.9
69%
78%
8%
Atchison
Kansas
51860
16894
1
5.9
53%
62%
9%
Taylor
West Virginia
48294
16894
1
5.9
58%
72%
14%
Tioga
New York
60699
51049
3
5.9
54%
59%
5%
Bates
Missouri
48442
17042
1
5.9
58%
75%
16%
Ford
Kansas
54604
34094
2
5.9
65%
66%
2%
Chambers
Alabama
42015
34157
2
5.9
54%
56%
2%
Effingham
Illinois
58943
34234
2
5.8
67%
77%
10%
Pulaski
Virginia
54086
34829
2
5.7
59%
68%
9%
Potter
Pennsylvania
49054
17464
1
5.7
68%
80%
12%
Bureau
Illinois
57935
34941
2
5.7
46%
56%
10%
Knox
Illinois
43404
52919
3
5.7
39%
48%
9%
Ben Hill
Georgia
35931
17653
1
5.7
57%
63%
6%
Yancey
North Carolina
47664
17794
1
5.6
52%
64%
12%
Laclede
Missouri
43969
35642
2
5.6
67%
80%
14%
Cross
Arkansas
45273
17851
1
5.6
62%
67%
5%
Randolph
Arkansas
42875
17969
1
5.6
57%
71%
13%
Jackson
Arkansas
38636
17974
1
5.6
56%
63%
8%
Clayton
Iowa
53223
18087
1
5.5
41%
58%
18%
Cowley
Kansas
51537
36285
2
5.5
62%
66%
4%
Blair
Pennsylvania
51004
127031
7
5.5
62%
71%
10%
Mariposa
California
52760
18243
1
5.5
55%
58%
4%
Appling
Georgia
43821
18261
1
5.5
73%
78%
6%
Pemiscot
Missouri
34280
18263
1
5.5
56%
66%
10%
Bosque
Texas
55179
18269
1
5.5
75%
81%
6%
Unicoi
Tennessee
44548
18278
1
5.5
69%
79%
9%
Lowndes
Georgia
46450
109734
6
5.5
54%
57%
3%
Independence
Arkansas
47903
36738
2
5.4
67%
73%
6%
Addison
Vermont
73574
36810
2
5.4
29%
28%
-2%
Greene
Virginia
73345
18461
1
5.4
60%
62%
2%
Patrick
Virginia
43568
18464
1
5.4
64%
76%
11%
Finney
Kansas
57412
37013
2
5.4
67%
63%
-4%
Inyo
California
59605
18513
1
5.4
53%
53%
0%
Clatsop
Oregon
59339
37070
2
5.4
39%
41%
3%
Southampton
Virginia
62327
18552
1
5.4
51%
57%
6%
Tuscola
Michigan
52342
55661
3
5.4
49%
66%
17%
Pearl River
Mississippi
45874
55788
3
5.4
80%
81%
1%
Dekalb
Tennessee
46407
18727
1
5.3
58%
74%
17%
Pierce
Georgia
46701
18818
1
5.3
81%
86%
5%
Adams
Washington
53535
18821
1
5.3
66%
66%
0%
Natrona
Wyoming
66104
75507
4
5.3
65%
71%
5%
New Madrid
Missouri
42115
18934
1
5.3
57%
72%
15%
Perry
Missouri
57032
18937
1
5.3
64%
79%
15%
Umatilla
Oregon
58286
76079
4
5.3
60%
62%
2%
Van Buren
Michigan
58733
76186
4
5.3
45%
54%
9%
Waseca
Minnesota
63907
19137
1
5.2
53%
62%
9%
Llano
Texas
55617
19316
1
5.2
76%
79%
4%
Perry
Indiana
53908
19327
1
5.2
38%
57%
19%
Daviess
Kentucky
52620
96762
5
5.2
54%
63%
9%
Newton
Missouri
53251
58117
3
5.2
69%
77%
8%
Davison
South Dakota
57367
19533
1
5.1
57%
65%
8%
Tishomingo
Mississippi
43341
19594
1
5.1
75%
86%
10%
Lincoln
Montana
43669
19670
1
5.1
62%
72%
10%
Wicomico
Maryland
54351
98843
5
5.1
52%
52%
0%
Crawford
Illinois
50352
19794
1
5.1
56%
72%
16%
Natchitoches
Louisiana
49536
39605
2
5.0
53%
54%
1%
Marion
Kentucky
48062
19831
1
5.0
50%
63%
13%
Gonzales
Texas
48425
19866
1
5.0
65%
72%
8%
Douglas
Illinois
64283
19970
1
5.0
60%
70%
10%
Minidoka
Idaho
56173
20112
1
5.0
74%
71%
-3%
East Feliciana
Louisiana
50041
20190
1
5.0
55%
55%
1%
Buena Vista
Iowa
57048
20332
1
4.9
50%
59%
9%
La Paz
Arizona
39407
20458
1
4.9
63%
67%
4%
Franklin
Tennessee
54319
41010
2
4.9
60%
70%
10%
Pierce
Wisconsin
75368
41125
2
4.9
44%
53%
9%
Montrose
Colorado
50707
41183
2
4.9
64%
68%
4%
Acadia
Louisiana
44728
61844
3
4.9
72%
77%
5%
Richland
Ohio
51883
124177
6
4.8
56%
66%
11%
Tallapoosa
Alabama
47100
41516
2
4.8
68%
70%
2%
Franklin
Louisiana
35484
20773
1
4.8
67%
71%
4%
Fayette
Iowa
53142
20839
1
4.8
41%
56%
15%
Martin
Minnesota
54602
20840
1
4.8
56%
67%
11%
Warren
Pennsylvania
52592
41767
2
4.8
52%
68%
15%
Midland
Michigan
69859
83592
4
4.8
51%
56%
5%
Colorado
Texas
55607
20898
1
4.8
69%
74%
5%
Winneshiek
Iowa
65482
21059
1
4.7
38%
47%
9%
Kandiyohi
Minnesota
64129
42270
2
4.7
52%
59%
7%
Uinta
Wyoming
70756
21137
1
4.7
68%
73%
4%
Coffee
Georgia
41675
42332
2
4.7
65%
69%
4%
Jay
Indiana
49447
21196
1
4.7
53%
71%
18%
Bertie
North Carolina
37899
21250
1
4.7
35%
37%
2%
Benton
Oregon
69148
85575
4
4.7
33%
28%
-5%
Vilas
Wisconsin
55576
21396
1
4.7
51%
60%
9%
Burnet
Texas
62827
42854
2
4.7
71%
76%
5%
Sullivan
Indiana
53375
21469
1
4.7
49%
72%
22%
Muskingum
Ohio
52105
86142
4
4.6
53%
65%
12%
Macon
Alabama
34281
21540
1
4.6
13%
16%
3%
Cherokee
Kansas
47682
21569
1
4.6
61%
72%
11%
Worth
Georgia
43142
21630
1
4.6
69%
74%
5%
Wabasha
Minnesota
63435
21658
1
4.6
50%
59%
9%
Jefferson
Oregon
52543
21670
1
4.6
53%
58%
5%
Washington
Iowa
63230
21693
1
4.6
49%
56%
7%
Newton
Mississippi
42962
21718
1
4.6
67%
69%
3%
Tyler
Texas
48254
21741
1
4.6
71%
83%
11%
Meriwether
Georgia
43571
21849
1
4.6
52%
57%
4%
Penobscot
Maine
50702
153849
7
4.5
47%
52%
5%
Franklin
Georgia
47691
22048
1
4.5
75%
83%
8%
Klamath
Oregon
53030
66345
3
4.5
65%
67%
2%
Scott
Tennessee
38750
22231
1
4.5
73%
85%
12%
Grafton
New Hampshire
62468
89108
4
4.5
35%
37%
2%
Gage
Nebraska
56817
22301
1
4.5
53%
63%
10%
Perry
Illinois
56880
22343
1
4.5
51%
70%
19%
Monroe
Wisconsin
60296
44736
2
4.5
45%
58%
12%
Gallatin
Montana
73731
89658
4
4.5
47%
44%
-3%
Hood River
Oregon
68835
22451
1
4.5
33%
30%
-3%
Siskiyou
California
45954
44929
2
4.5
54%
55%
2%
Jerome
Idaho
56320
22469
1
4.5
72%
69%
-3%
Tazewell
Virginia
43619
45078
2
4.4
66%
82%
16%
Williams
North Dakota
84606
22552
1
4.4
67%
79%
12%
Jefferson
Pennsylvania
50789
45231
2
4.4
64%
78%
14%
Payette
Idaho
53643
22621
1
4.4
70%
75%
5%
Emanuel
Georgia
38529
22664
1
4.4
62%
68%
6%
Pointe Coupee
Louisiana
48011
22771
1
4.4
54%
58%
4%
Bibb
Alabama
47918
22867
1
4.4
72%
76%
4%
Barron
Wisconsin
54372
45850
2
4.4
46%
60%
14%
Jersey
Illinois
63351
22944
1
4.4
50%
70%
20%
Wayne
Indiana
47885
68853
3
4.4
51%
63%
12%
Perry
Pennsylvania
65401
45995
2
4.3
66%
74%
8%
Laramie
Wyoming
69613
92127
4
4.3
59%
61%
2%
Seward
Kansas
55727
23036
1
4.3
71%
63%
-8%
Orangeburg
South Carolina
38736
92346
4
4.3
30%
31%
0%
Mcdonald
Missouri
39615
23087
1
4.3
68%
80%
12%
Cassia
Idaho
53284
23088
1
4.3
80%
73%
-8%
Kay
Oklahoma
48522
46460
2
4.3
71%
72%
2%
Mercer
Pennsylvania
54099
116558
5
4.3
49%
60%
11%
Hillsdale
Michigan
50015
46643
2
4.3
55%
71%
16%
Linn
Oregon
61084
116910
5
4.3
54%
57%
3%
Saline
Missouri
47324
23406
1
4.3
50%
64%
14%
Johnson
Kentucky
31202
23415
1
4.3
70%
84%
14%
Culpeper
Virginia
79739
46850
2
4.3
54%
60%
6%
Limestone
Texas
43644
23428
1
4.3
66%
75%
9%
Routt
Colorado
87691
23447
1
4.3
36%
37%
2%
Osceola
Michigan
47343
23506
1
4.3
54%
69%
15%
Northumberland
Pennsylvania
47967
94366
4
4.2
56%
69%
13%
Fannin
Georgia
47980
23663
1
4.2
74%
82%
8%
Butts
Georgia
47410
23674
1
4.2
65%
71%
5%
King George
Virginia
85657
23675
1
4.2
56%
61%
5%
Meigs
Ohio
43754
23745
1
4.2
58%
73%
15%
Noble
Indiana
60980
47541
2
4.2
57%
72%
15%
Muscogee
Georgia
47035
190417
8
4.2
40%
39%
-1%
Carter
Oklahoma
51895
47622
2
4.2
70%
74%
4%
Panola
Texas
56882
23824
1
4.2
74%
81%
7%
Oktibbeha
Mississippi
41631
47692
2
4.2
50%
47%
-2%
Apache
Arizona
35386
71676
3
4.2
35%
30%
-5%
Macoupin
Illinois
54174
47808
2
4.2
44%
64%
20%
Beaufort
North Carolina
49410
47820
2
4.2
58%
61%
2%
Otsego
Michigan
52392
24132
1
4.1
54%
66%
12%
Scott
Indiana
50571
24174
1
4.1
50%
67%
17%
Stark
North Dakota
68759
24321
1
4.1
63%
79%
16%
Letcher
Kentucky
32435
24551
1
4.1
65%
80%
15%
Poinsett
Arkansas
40536
24568
1
4.1
62%
71%
9%
White
Indiana
58295
24635
1
4.1
53%
69%
15%
Boyd
Kentucky
50017
49580
2
4.0
55%
66%
11%
Churchill
Nevada
56335
24810
1
4.0
64%
72%
7%
Dickson
Tennessee
59126
49733
2
4.0
60%
71%
11%
Gillespie
Texas
62143
24899
1
4.0
78%
79%
2%
Jasper
South Carolina
50790
24939
1
4.0
38%
45%
7%
Plymouth
Iowa
69165
24995
1
4.0
62%
73%
11%
Woodford
Kentucky
67815
25025
1
4.0
58%
57%
-1%
Coffee
Alabama
57299
50104
2
4.0
74%
76%
2%
Anderson
Tennessee
50973
75160
3
4.0
62%
64%
2%
Comanche
Oklahoma
51184
125368
5
4.0
59%
59%
0%
Polk
Oregon
69757
75625
3
4.0
49%
47%
-2%
Hart
Georgia
50647
25217
1
4.0
65%
72%
7%
Henry
Illinois
61680
50438
2
4.0
45%
57%
11%
Wasco
Oregon
56993
25266
1
4.0
45%
49%
4%
Cape Girardeau
Missouri
57618
75895
3
4.0
66%
73%
7%
Camden
Georgia
58552
50697
2
3.9
61%
65%
4%
Adams
Pennsylvania
67706
101485
4
3.9
59%
66%
7%
Randolph
Missouri
48043
25437
1
3.9
61%
73%
12%
Meade
South Dakota
59981
25454
1
3.9
66%
73%
7%
Leavenworth
Kansas
75840
76504
3
3.9
55%
58%
3%
Montezuma
Colorado
52641
25539
1
3.9
59%
61%
2%
Gladwin
Michigan
46458
25675
1
3.9
48%
65%
17%
Erie
Ohio
60790
77070
3
3.9
42%
52%
10%
Allen
Louisiana
47111
25732
1
3.9
67%
74%
7%
Union
Oregon
54264
25796
1
3.9
60%
65%
5%
Lyon
Minnesota
63849
25865
1
3.9
50%
59%
10%
Cleburne
Arkansas
46214
25991
1
3.8
70%
78%
8%
Lyon
Nevada
59406
52049
2
3.8
58%
67%
10%
San Juan
New Mexico
46201
130145
5
3.8
60%
61%
1%
Texas
Missouri
38914
26048
1
3.8
66%
81%
15%
Mille Lacs
Minnesota
59262
26088
1
3.8
52%
64%
12%
Mcnairy
Tennessee
45469
26109
1
3.8
68%
78%
10%
Dickinson
Michigan
53751
26111
1
3.8
53%
65%
12%
Waupaca
Wisconsin
61773
52369
2
3.8
48%
62%
14%
Nicholas
West Virginia
40023
26221
1
3.8
51%
76%
25%
Jefferson
Idaho
63078
26236
1
3.8
82%
74%
-8%
Boone
Iowa
63975
26281
1
3.8
45%
53%
8%
Cochise
Arizona
48650
131789
5
3.8
59%
56%
-3%
Monroe
Georgia
70488
26467
1
3.8
65%
70%
4%
Jackson
Oklahoma
48430
26496
1
3.8
75%
76%
2%
Montgomery
Kentucky
52903
26516
1
3.8
58%
69%
11%
Ashland
Ohio
52554
53127
2
3.8
60%
71%
11%
Jackson
Alabama
44322
53128
2
3.8
67%
79%
12%
Russell
Alabama
43670
53188
2
3.8
46%
48%
2%
Lauderdale
Mississippi
41604
80229
3
3.7
59%
60%
1%
Mingo
West Virginia
34698
26789
1
3.7
55%
83%
28%
Logan
Kentucky
48902
26835
1
3.7
64%
71%
8%
Douglas
Oregon
48940
107638
4
3.7
58%
65%
6%
Coconino
Arizona
58301
134651
5
3.7
41%
35%
-6%
Hardeman
Tennessee
40989
27174
1
3.7
46%
53%
7%
Codington
South Dakota
63442
27231
1
3.7
53%
67%
14%
Maverick
Texas
40017
54521
2
3.7
21%
21%
0%
Orange
Texas
62976
81930
3
3.7
73%
80%
7%
Pulaski
Arkansas
52684
383632
14
3.6
44%
38%
-5%
Barbour
Alabama
35972
27411
1
3.6
50%
52%
2%
Morton
North Dakota
68051
27600
1
3.6
59%
72%
12%
Wells
Indiana
61636
27642
1
3.6
65%
76%
11%
Door
Wisconsin
64217
27730
1
3.6
41%
49%
8%
Decatur
Georgia
40473
27813
1
3.6
57%
59%
2%
Glenn
California
55682
28129
1
3.6
60%
61%
1%
Henry
Ohio
61351
28186
1
3.5
56%
67%
11%
Marion
West Virginia
51300
56482
2
3.5
49%
64%
15%
Washington
Indiana
51948
28290
1
3.5
58%
72%
14%
Windsor
Vermont
61843
56654
2
3.5
29%
29%
0%
Gilmer
Georgia
57007
28335
1
3.5
75%
82%
7%
Beaver
Pennsylvania
60323
170567
6
3.5
51%
58%
7%
Austin
Texas
68311
28443
1
3.5
75%
79%
4%
Bell
Texas
54831
313000
11
3.5
55%
55%
0%
Bradford
Florida
47509
28480
1
3.5
70%
74%
4%
Carroll
Tennessee
43258
28518
1
3.5
64%
75%
11%
Adams
Ohio
43145
28550
1
3.5
61%
76%
16%
Del Norte
California
48979
28632
1
3.5
52%
54%
2%
Carter
Tennessee
39964
57358
2
3.5
73%
80%
7%
Van Wert
Ohio
55361
28698
1
3.5
63%
76%
13%
Ripley
Indiana
61219
28814
1
3.5
64%
77%
13%
Russell
Virginia
40345
28862
1
3.5
56%
78%
22%
Marlboro
South Carolina
34532
28873
1
3.5
37%
41%
4%
Oxford
Maine
50344
57752
2
3.5
41%
52%
11%
Montgomery
Tennessee
57606
173307
6
3.5
53%
56%
3%
Lee
North Carolina
53114
57951
2
3.5
54%
55%
1%
Rogers
Oklahoma
67054
86988
3
3.4
72%
76%
4%
Wood
West Virginia
49209
86990
3
3.4
64%
71%
8%
Cumberland
North Carolina
46599
320267
11
3.4
41%
40%
-1%
Clarke
Georgia
41036
116668
4
3.4
34%
28%
-5%
Mendocino
California
52309
87828
3
3.4
27%
29%
2%
Hocking
Ohio
51016
29374
1
3.4
49%
66%
17%
Bossier
Louisiana
54080
117522
4
3.4
71%
71%
0%
Copiah
Mississippi
42299
29430
1
3.4
46%
47%
1%
Laurel
Kentucky
44033
58944
2
3.4
78%
83%
4%
Clay
Minnesota
64874
59162
2
3.4
41%
46%
5%
Dodge
Wisconsin
61730
88748
3
3.4
54%
62%
8%
Calhoun
Alabama
47747
118510
4
3.4
66%
69%
3%
Pine
Minnesota
55684
29727
1
3.4
48%
59%
12%
Washington
Vermont
65879
59577
2
3.4
28%
26%
-3%
Lowndes
Mississippi
49251
59836
2
3.3
51%
52%
1%
Lumpkin
Georgia
57078
29998
1
3.3
75%
77%
2%
Granville
North Carolina
54300
60063
2
3.3
46%
50%
3%
Montgomery
Illinois
51665
30076
1
3.3
48%
66%
19%
Wayne
Georgia
47382
30115
1
3.3
72%
78%
6%
Genesee
Michigan
50554
424926
14
3.3
33%
43%
10%
Garfield
Oklahoma
58381
60756
2
3.3
75%
74%
-2%
Bryan
Georgia
79296
30382
1
3.3
71%
69%
-2%
Franklin
Maine
51136
30732
1
3.3
39%
48%
9%
Rutland
Vermont
51903
61566
2
3.2
37%
42%
5%
Centre
Pennsylvania
61036
154127
5
3.2
44%
46%
3%
Washington
Ohio
52565
61683
2
3.2
57%
69%
12%
Tuscarawas
Ohio
54150
92542
3
3.2
48%
65%
18%
Otsego
New York
52414
62232
2
3.2
46%
52%
6%
Bibb
Georgia
43066
155715
5
3.2
41%
38%
-2%
Harrison
Mississippi
49619
187785
6
3.2
63%
64%
1%
Malheur
Oregon
42019
31319
1
3.2
69%
69%
0%
Adams
Nebraska
55182
31388
1
3.2
62%
69%
6%
Polk
Minnesota
60582
31640
1
3.2
47%
61%
14%
Franklin
Alabama
44874
31729
1
3.2
69%
79%
10%
Tehama
California
51672
63604
2
3.1
61%
65%
4%
Ottawa
Oklahoma
41530
31831
1
3.1
62%
71%
10%
Elk
Pennsylvania
55462
31850
1
3.1
47%
69%
23%
Ionia
Michigan
59582
63884
2
3.1
52%
62%
10%
Kleberg
Texas
47169
32106
1
3.1
46%
46%
0%
Lafourche
Louisiana
54145
96328
3
3.1
71%
77%
5%
Dillon
South Carolina
35483
32120
1
3.1
44%
48%
4%
Smyth
Virginia
41964
32163
1
3.1
64%
76%
12%
Claiborne
Tennessee
40116
32234
1
3.1
69%
80%
11%
Adams
Mississippi
34583
32251
1
3.1
42%
42%
1%
Monongalia
West Virginia
55652
96791
3
3.1
47%
51%
4%
Portage
Ohio
57439
161386
5
3.1
45%
52%
8%
Reno
Kansas
53371
64597
2
3.1
61%
64%
3%
Leflore
Mississippi
29687
32307
1
3.1
31%
29%
-3%
Jefferson
Indiana
53378
32394
1
3.1
52%
63%
11%
Galveston
Texas
73214
292607
9
3.1
59%
60%
1%
Becker
Minnesota
61311
32520
1
3.1
52%
63%
11%
Carbon
Pennsylvania
59985
65220
2
3.1
48%
65%
17%
Nicollet
Minnesota
71067
32780
1
3.1
44%
47%
3%
Washington
Maine
39068
32811
1
3.0
48%
56%
7%
Sumter
Georgia
40250
32816
1
3.0
47%
48%
1%
Warren
New York
63240
65697
2
3.0
48%
50%
2%
Madison
Indiana
54145
131642
4
3.0
46%
60%
14%
Elkhart
Indiana
55782
197646
6
3.0
55%
64%
9%
Pike
Alabama
41271
32957
1
3.0
57%
58%
1%
Oconee
Georgia
100878
32984
1
3.0
71%
67%
-4%
Marion
South Carolina
35138
33001
1
3.0
36%
38%
2%
Huron
Michigan
49126
33039
1
3.0
49%
67%
18%
Caroline
Maryland
60143
33093
1
3.0
61%
66%
6%
Transylvania
North Carolina
55628
33094
1
3.0
56%
59%
3%
Chester
South Carolina
45400
33096
1
3.0
45%
51%
6%
Botetourt
Virginia
74178
33165
1
3.0
66%
71%
5%
Scott
Iowa
65724
165841
5
3.0
42%
45%
3%
Williamson
Illinois
56958
66369
2
3.0
56%
68%
11%
Morrison
Minnesota
61847
33204
1
3.0
58%
73%
15%
Mccurtain
Oklahoma
40803
33212
1
3.0
73%
81%
7%
Clinton
Indiana
55336
33234
1
3.0
56%
71%
16%
Jackson
Ohio
50671
33268
1
3.0
59%
73%
14%
Hanover
Virginia
90824
99948
3
3.0
66%
63%
-3%
Mohave
Arizona
49712
200181
6
3.0
66%
73%
7%
Winnebago
Wisconsin
59643
167059
5
3.0
43%
50%
7%
Richmond
Georgia
44810
201005
6
3.0
34%
32%
-1%
Gibson
Indiana
61872
33537
1
3.0
56%
72%
16%
Champaign
Illinois
53485
201332
6
3.0
40%
36%
-4%
Chautauqua
New York
50143
134768
4
3.0
49%
58%
10%
Kendall
Texas
94899
33700
1
3.0
77%
78%
1%
Sioux
Iowa
71566
33705
1
3.0
81%
81%
0%
Washington
Texas
59039
33782
1
3.0
71%
74%
3%
Tazewell
Illinois
66206
135433
4
3.0
52%
60%
8%
Fannin
Texas
56123
33905
1
2.9
69%
79%
10%
Dare
North Carolina
63033
34015
1
2.9
54%
58%
4%
Ector
Texas
65564
137145
4
2.9
74%
68%
-5%
Lonoke
Arkansas
62782
68634
2
2.9
73%
74%
1%
Lincoln
Maine
58619
34399
1
2.9
43%
45%
2%
Putnam
Ohio
73454
34464
1
2.9
70%
80%
10%
Tippecanoe
Indiana
51228
172963
5
2.9
44%
49%
6%
Craven
North Carolina
53372
103908
3
2.9
56%
59%
3%
Clark
Wisconsin
54296
34693
1
2.9
45%
64%
19%
Harvey
Kansas
62961
34726
1
2.9
58%
58%
0%
Christian
Illinois
51573
34786
1
2.9
52%
68%
16%
Pottawatomie
Oklahoma
52747
69608
2
2.9
69%
70%
1%
Jefferson
Ohio
47652
69614
2
2.9
49%
66%
17%
Grant
Indiana
47509
69975
2
2.9
56%
67%
11%
Portage
Wisconsin
58248
70053
2
2.9
35%
45%
10%
Lubbock
Texas
54733
280237
8
2.9
68%
66%
-2%
Imperial
California
48102
175234
5
2.9
36%
26%
-10%
Delaware
Ohio
110252
175250
5
2.9
59%
55%
-4%
Isabella
Michigan
46677
70334
2
2.8
40%
49%
9%
Seneca
New York
51064
35199
1
2.8
48%
52%
4%
Washoe
Nevada
71733
422528
12
2.8
43%
45%
3%
Sagadahoc
Maine
65841
35226
1
2.8
41%
43%
2%
Citrus
Florida
49762
141129
4
2.8
57%
68%
11%
Shasta
California
61464
177291
5
2.8
62%
65%
3%
Muskogee
Oklahoma
43392
71110
2
2.8
58%
62%
5%
Whitley
Kentucky
38191
35586
1
2.8
73%
82%
9%
Spartanburg
South Carolina
55588
284713
8
2.8
60%
63%
3%
Hardin
Kentucky
57711
106933
3
2.8
60%
62%
3%
Wapello
Iowa
50533
35667
1
2.8
42%
58%
16%
Prince George
Virginia
74518
35716
1
2.8
55%
57%
2%
Navajo
Arizona
40676
107551
3
2.8
55%
51%
-4%
Aroostook
Maine
40675
71720
2
2.8
44%
55%
11%
Oneida
Wisconsin
62765
35919
1
2.8
44%
56%
13%
Vanderburgh
Indiana
51603
179833
5
2.8
48%
56%
8%
Douglas
Minnesota
67592
35988
1
2.8
54%
64%
10%
Perry
Ohio
51875
36058
1
2.8
50%
68%
18%
Scotland
North Carolina
39197
36100
1
2.8
42%
45%
3%
El Dorado
California
86202
181194
5
2.8
54%
53%
-2%
Putnam
Tennessee
49083
72564
2
2.8
63%
70%
7%
Webster
Missouri
54844
36287
1
2.8
64%
77%
13%
Ware
Georgia
37642
36340
1
2.8
67%
70%
3%
Albany
Wyoming
52216
36438
1
2.7
46%
45%
-2%
Grays Harbor
Washington
59346
72882
2
2.7
41%
50%
8%
Missoula
Montana
57279
109494
3
2.7
35%
38%
2%
Mesa
Colorado
60249
146313
4
2.7
64%
64%
0%
Houghton
Michigan
45006
36686
1
2.7
51%
54%
4%
Logan
West Virginia
38533
36743
1
2.7
54%
80%
26%
Miami
Indiana
53658
36800
1
2.7
59%
74%
15%
Surry
North Carolina
48637
73694
2
2.7
63%
74%
10%
Greenup
Kentucky
52179
36885
1
2.7
56%
71%
15%
Gloucester
Virginia
71715
36950
1
2.7
63%
67%
4%
Lafayette
Louisiana
60053
222051
6
2.7
65%
65%
0%
Fulton
Illinois
50461
37050
1
2.7
38%
54%
15%
Delta
Michigan
48880
37065
1
2.7
46%
60%
14%
Bennington
Vermont
56948
37089
1
2.7
32%
34%
2%
Christian
Kentucky
46390
74179
2
2.7
60%
64%
4%
Graham
Arizona
50685
37110
1
2.7
70%
40%
-30%
Allegany
Maryland
48170
75021
2
2.7
62%
69%
8%
Williams
Ohio
54239
37535
1
2.7
54%
69%
15%
Ellis
Texas
78341
150462
4
2.7
71%
71%
0%
Madison
Idaho
46177
37623
1
2.7
85%
57%
-28%
Oconto
Wisconsin
66401
37652
1
2.7
46%
66%
20%
Coryell
Texas
53083
75645
2
2.6
63%
67%
4%
Webster
Iowa
53344
37915
1
2.6
45%
58%
13%
Liberty
Texas
53274
75868
2
2.6
71%
78%
6%
Erath
Texas
53044
37948
1
2.6
77%
81%
4%
Chatham
Georgia
57122
265871
7
2.6
42%
41%
-2%
Monroe
Michigan
64341
151932
4
2.6
47%
58%
11%
Amador
California
62640
38042
1
2.6
56%
59%
3%
Brown
Texas
56040
38145
1
2.6
80%
86%
5%
Escambia
Alabama
42712
38292
1
2.6
64%
67%
3%
Kings
California
57297
153174
4
2.6
56%
53%
-3%
Montgomery
Alabama
52711
229844
6
2.6
40%
35%
-5%
Dyer
Tennessee
48770
38349
1
2.6
68%
76%
8%
Valencia
New Mexico
54867
76759
2
2.6
45%
48%
2%
Ouachita
Louisiana
43235
153910
4
2.6
62%
61%
-1%
Harnett
North Carolina
55619
115733
3
2.6
58%
60%
2%
Douglas
Washington
63086
38589
1
2.6
60%
62%
2%
Kanawha
West Virginia
48334
192976
5
2.6
50%
58%
8%
Catawba
North Carolina
53688
154389
4
2.6
62%
67%
5%
Lawrence
Missouri
45746
38601
1
2.6
68%
78%
11%
Greene
Pennsylvania
56599
38640
1
2.6
49%
69%
19%
Calcasieu
Louisiana
53050
193230
5
2.6
61%
65%
3%
Twin Falls
Idaho
56141
77517
2
2.6
67%
66%
-1%
Waldo
Maine
51073
38801
1
2.6
43%
46%
3%
Jefferson
Illinois
50531
38806
1
2.6
54%
69%
15%
Somerset
Pennsylvania
49082
77626
2
2.6
62%
77%
15%
Cass
Indiana
51777
38965
1
2.6
53%
68%
15%
Defiance
Ohio
60918
39007
1
2.6
54%
64%
10%
Cheatham
Tennessee
62786
39103
1
2.6
65%
71%
6%
Crawford
Kansas
42723
39185
1
2.6
48%
58%
10%
Brazoria
Texas
83704
314494
8
2.5
64%
60%
-4%
Nez Perce
Idaho
67645
39339
1
2.5
58%
62%
4%
Island
Washington
72173
78681
2
2.5
46%
43%
-3%
Marion
Illinois
52291
39417
1
2.5
50%
69%
19%
Floyd
Kentucky
35828
39446
1
2.5
49%
73%
23%
Raleigh
West Virginia
45386
78904
2
2.5
62%
74%
12%
Deschutes
Oregon
71880
157894
4
2.5
49%
46%
-3%
Sussex
Delaware
64839
197871
5
2.5
54%
59%
5%
Glynn
Georgia
58017
79816
2
2.5
61%
63%
1%
Saginaw
Michigan
48471
199911
5
2.5
41%
48%
8%
Cullman
Alabama
50897
80459
2
2.5
82%
87%
5%
Des Moines
Iowa
53547
40318
1
2.5
38%
50%
12%
Tift
Georgia
47764
40339
1
2.5
66%
67%
1%
Tangipahoa
Louisiana
47860
121425
3
2.5
65%
65%
0%
Manitowoc
Wisconsin
61326
81349
2
2.5
45%
57%
12%
Wilson
North Carolina
42414
81359
2
2.5
47%
46%
-1%
Campbell
Tennessee
42500
40696
1
2.5
68%
79%
11%
Kent
Delaware
58804
162912
4
2.5
45%
50%
5%
Levy
Florida
41405
40735
1
2.5
63%
71%
8%
Marshall
Iowa
55631
40746
1
2.5
44%
51%
6%
Clearfield
Pennsylvania
46967
81562
2
2.5
55%
73%
17%
Boone
Missouri
58029
163232
4
2.5
43%
43%
0%
Hinds
Mississippi
44773
245629
6
2.4
30%
27%
-4%
Talladega
Alabama
47719
82110
2
2.4
59%
62%
3%
Webster
Louisiana
38386
41215
1
2.4
62%
64%
1%
Okanogan
Washington
44777
41257
1
2.4
52%
56%
4%
Mayes
Oklahoma
49293
41283
1
2.4
64%
74%
9%
Ottawa
Ohio
63352
41381
1
2.4
46%
57%
11%
Newport
Rhode Island
80862
82852
2
2.4
37%
37%
-1%
Wise
Virginia
42372
41463
1
2.4
63%
80%
17%
Caldwell
North Carolina
48512
82998
2
2.4
64%
73%
9%
Bannock
Idaho
53306
83071
2
2.4
55%
51%
-4%
Stark
Ohio
55623
375321
9
2.4
46%
56%
10%
Dubois
Indiana
63869
41875
1
2.4
51%
67%
16%
Anchorage
Alaska
82512
293227
7
2.4
49%
31%
-19%
Clinton
Ohio
52870
41930
1
2.4
64%
74%
10%
Kitsap
Washington
79268
251809
6
2.4
43%
39%
-3%
Tioga
Pennsylvania
51324
42008
1
2.4
63%
74%
11%
Avoyelles
Louisiana
38316
42103
1
2.4
60%
67%
7%
Barren
Kentucky
44859
42164
1
2.4
66%
73%
7%
Greene
Arkansas
47098
42192
1
2.4
63%
73%
10%
Pitt
North Carolina
52961
168817
4
2.4
45%
44%
-1%
Bay
Florida
58376
169272
4
2.4
70%
71%
1%
Fayette
Kentucky
58981
296765
7
2.4
47%
42%
-5%
Minnehaha
South Dakota
63162
169987
4
2.4
49%
54%
5%
Bryan
Oklahoma
44074
42574
1
2.3
68%
76%
8%
Escambia
Florida
52822
298043
7
2.3
59%
58%
-1%
Clark
Washington
80407
427044
10
2.3
46%
46%
0%
Rockdale
Georgia
60281
85434
2
2.3
45%
36%
-9%
Muscatine
Iowa
61767
42738
1
2.3
41%
49%
8%
Camden
New Jersey
73168
513607
12
2.3
32%
32%
0%
Lackawanna
Pennsylvania
53655
214367
5
2.3
37%
47%
10%
Muskegon
Michigan
50730
172068
4
2.3
35%
46%
12%
Habersham
Georgia
51296
43080
1
2.3
79%
81%
2%
Bexar
Texas
58956
1723780
40
2.3
47%
41%
-6%
Wilson
Texas
76905
43122
1
2.3
67%
72%
5%
Stafford
Virginia
109090
129745
3
2.3
53%
51%
-1%
Mckean
Pennsylvania
53266
43356
1
2.3
58%
71%
14%
Waller
Texas
61822
43422
1
2.3
53%
63%
9%
Victoria
Texas
57344
86878
2
2.3
66%
68%
2%
Madison
Ohio
65696
43446
1
2.3
61%
67%
7%
Angelina
Texas
51750
86953
2
2.3
67%
72%
5%
Orleans
Louisiana
45092
347858
8
2.3
19%
15%
-5%
Stevens
Washington
55000
43486
1
2.3
59%
67%
8%
Highland
Ohio
47126
43554
1
2.3
62%
76%
14%
Sweetwater
Wyoming
80639
43621
1
2.3
62%
71%
9%
Chilton
Alabama
49692
43682
1
2.3
78%
82%
4%
Berkshire
Massachusetts
58805
131144
3
2.3
22%
26%
3%
Sullivan
New Hampshire
63518
43716
1
2.3
40%
48%
7%
Crawford
Ohio
49484
43718
1
2.3
58%
71%
13%
Ada
Idaho
72295
393531
9
2.3
52%
48%
-4%
Erie
New York
60620
918652
21
2.3
40%
44%
4%
Nye
Nevada
48490
43769
1
2.3
55%
68%
13%
Santa Cruz
California
85770
263054
6
2.3
20%
17%
-2%
Dunn
Wisconsin
61506
43898
1
2.3
42%
52%
10%
Davis
Utah
87610
307856
7
2.3
70%
45%
-25%
Camden
Missouri
51460
43985
1
2.3
64%
75%
12%
Washington
Wisconsin
81928
131971
3
2.3
64%
66%
2%
Polk
Wisconsin
63910
44156
1
2.3
50%
61%
11%
Moore
North Carolina
63942
88569
2
2.3
60%
63%
2%
Indiana
Pennsylvania
51299
88847
2
2.3
53%
66%
13%
Windham
Vermont
52068
44510
1
2.2
25%
24%
-1%
Monroe
Tennessee
50506
44608
1
2.2
68%
78%
10%
Whitman
Washington
45906
44791
1
2.2
46%
43%
-3%
Grant
Washington
57152
89744
2
2.2
63%
65%
3%
Mcdowell
North Carolina
46370
45016
1
2.2
63%
73%
11%
Sevier
Tennessee
54476
90072
2
2.2
73%
79%
5%
Itasca
Minnesota
58660
45043
1
2.2
42%
54%
12%
Branch
Michigan
52255
45137
1
2.2
52%
67%
15%
Bedford
Tennessee
50539
45161
1
2.2
66%
75%
9%
Campbell
Kentucky
66520
90532
2
2.2
60%
59%
-1%
Polk
Texas
50416
45395
1
2.2
68%
76%
8%
Flathead
Montana
61334
90901
2
2.2
58%
65%
7%
Fayette
Pennsylvania
48055
136446
3
2.2
50%
64%
15%
Lawrence
Pennsylvania
50979
90968
2
2.2
52%
62%
10%
Ulster
New York
64090
182435
4
2.2
38%
42%
4%
Napa
California
90230
136858
3
2.2
33%
28%
-4%
Colquitt
Georgia
41899
45628
1
2.2
68%
73%
4%
Bristol
Massachusetts
69857
548612
12
2.2
37%
42%
5%
San Joaquin
California
68458
687744
15
2.2
44%
40%
-4%
Pittsburg
Oklahoma
47215
45854
1
2.2
68%
74%
6%
Auglaize
Ohio
64227
45939
1
2.2
70%
79%
9%
Leon
Florida
55081
276058
6
2.2
37%
35%
-2%
Fayette
West Virginia
41430
46042
1
2.2
50%
68%
17%
Butler
Ohio
68611
368630
8
2.2
61%
62%
1%
Multnomah
Oregon
72469
737902
16
2.2
21%
17%
-4%
Lawrence
Indiana
56261
46124
1
2.2
59%
73%
14%
Buffalo
Nebraska
64759
46165
1
2.2
68%
69%
1%
Iron
Utah
58307
46310
1
2.2
76%
65%
-11%
Lauderdale
Alabama
48188
92679
2
2.2
63%
71%
7%
Chesterfield
South Carolina
42441
46665
1
2.1
51%
56%
5%
Pima
Arizona
56150
982154
21
2.1
46%
40%
-7%
Lincoln
Louisiana
41608
46801
1
2.1
56%
58%
2%
Fremont
Colorado
52239
46837
1
2.1
64%
69%
5%
Hopkins
Kentucky
48769
46899
1
2.1
62%
75%
14%
Cumberland
Maine
75254
281457
6
2.1
34%
34%
-1%
Washington
Louisiana
35505
47093
1
2.1
66%
67%
2%
Osage
Oklahoma
50667
47416
1
2.1
62%
66%
4%
Hoke
North Carolina
48420
47466
1
2.1
40%
43%
2%
Lafayette
Mississippi
54034
47496
1
2.1
56%
55%
-1%
Stephenson
Illinois
51786
47649
1
2.1
46%
54%
9%
Franklin
Vermont
65056
47806
1
2.1
37%
41%
4%
Cambria
Pennsylvania
48798
143498
3
2.1
49%
67%
18%
Carroll
New Hampshire
64495
47836
1
2.1
46%
49%
3%
Clay
Florida
75776
191395
4
2.1
71%
70%
-1%
El Paso
Colorado
72675
626928
13
2.1
59%
56%
-2%
Newaygo
Michigan
51772
48393
1
2.1
51%
67%
16%
Hendricks
Indiana
85827
145867
3
2.1
61%
64%
3%
Loudon
Tennessee
65226
48725
1
2.1
71%
75%
4%
Merrimack
New Hampshire
75800
146400
3
2.0
42%
45%
3%
Warren
Mississippi
46606
48840
1
2.0
51%
50%
-1%
Racine
Wisconsin
61691
195510
4
2.0
46%
50%
4%
Elko
Nevada
83287
48926
1
2.0
68%
73%
5%
Curry
New Mexico
45623
48949
1
2.0
66%
68%
1%
Guilford
North Carolina
55820
489681
10
2.0
40%
38%
-2%
Val Verde
Texas
45034
49019
1
2.0
45%
43%
-2%
Harford
Maryland
91492
245177
5
2.0
58%
58%
0%
Boulder
Colorado
88341
295166
6
2.0
26%
22%
-4%
Madison
Tennessee
50401
98395
2
2.0
53%
56%
3%
Cortland
New York
55143
49294
1
2.0
44%
49%
5%
Adams
Colorado
75341
443715
9
2.0
40%
41%
1%
Columbia
Oregon
72285
49343
1
2.0
42%
50%
8%
Steuben
New York
53167
98930
2
2.0
58%
64%
6%
Henry
Indiana
49293
49476
1
2.0
51%
69%
18%
Bradley
Tennessee
52534
99078
2
2.0
74%
77%
3%
Bedford
Pennsylvania
54251
49709
1
2.0
72%
83%
11%
Bristol
Rhode Island
87926
49853
1
2.0
36%
35%
-1%
Lenawee
Michigan
55466
99763
2
2.0
47%
58%
11%
Cass
North Dakota
63977
150230
3
2.0
46%
49%
4%
Grundy
Illinois
83135
50144
1
2.0
48%
58%
10%
Box Elder
Utah
69380
50155
1
2.0
80%
62%
-18%
Kent
Michigan
66560
603219
12
2.0
49%
48%
-1%
Franklin
Missouri
61428
101508
2
2.0
55%
71%
15%
Fond Du Lac
Wisconsin
65905
101665
2
2.0
54%
60%
7%
Cherokee
Texas
46576
50923
1
2.0
71%
77%
6%
Crittenden
Arkansas
41976
50937
1
2.0
42%
44%
2%
Montgomery
Texas
88833
459018
9
2.0
76%
73%
-2%
Washington
Oklahoma
62515
51045
1
2.0
72%
71%
-1%
Washington
Mississippi
31018
51078
1
2.0
32%
31%
-1%
Grant
Wisconsin
56418
51233
1
2.0
37%
51%
13%
Cleveland
Oklahoma
64706
256895
5
1.9
62%
57%
-5%
Winona
Minnesota
64219
51419
1
1.9
39%
46%
7%
La Plata
Colorado
77829
51431
1
1.9
41%
40%
-1%
Worcester
Maryland
65821
51431
1
1.9
57%
61%
4%
Jefferson
Tennessee
50332
51437
1
1.9
71%
77%
7%
Whitfield
Georgia
53115
102934
2
1.9
69%
70%
1%
Washington
Pennsylvania
65558
207875
4
1.9
52%
61%
9%
Eagle
Colorado
89268
52126
1
1.9
38%
36%
-2%
Somerset
Maine
45333
52231
1
1.9
46%
58%
11%
Berkeley
West Virginia
63012
104641
2
1.9
56%
66%
10%
Spokane
Washington
59976
472147
9
1.9
49%
50%
1%
Van Zandt
Texas
55554
52637
1
1.9
77%
84%
7%
San Diego
California
83576
3105989
59
1.9
44%
37%
-7%
Hays
Texas
72890
158312
3
1.9
50%
47%
-3%
Coffee
Tennessee
54931
52780
1
1.9
64%
72%
8%
Pulaski
Missouri
55620
52803
1
1.9
64%
73%
10%
Wayne
Pennsylvania
56265
52895
1
1.9
56%
68%
12%
Darke
Ohio
56824
52968
1
1.9
67%
79%
11%
Allen
Ohio
58271
106205
2
1.9
60%
66%
7%
Pueblo
Colorado
51075
159477
3
1.9
42%
46%
4%
Washington
Oregon
85665
531744
10
1.9
38%
31%
-7%
Essex
Massachusetts
83253
744644
14
1.9
39%
36%
-3%
Jackson
Michigan
56001
160201
3
1.9
48%
57%
9%
Ogle
Illinois
63565
53477
1
1.9
53%
59%
6%
Gila
Arizona
45980
53569
1
1.9
63%
39%
-24%
El Paso
Texas
48629
804338
15
1.9
33%
26%
-7%
Androscoggin
Maine
58958
107623
2
1.9
41%
51%
9%
Bay
Michigan
50130
107703
2
1.9
41%
53%
12%
Greene
Ohio
69709
161605
3
1.9
59%
59%
1%
Coles
Illinois
50467
53924
1
1.9
48%
59%
12%
Brunswick
North Carolina
63712
107992
2
1.9
58%
63%
4%
Boone
Illinois
72426
54160
1
1.8
47%
53%
6%
Lake
Illinois
92638
704596
13
1.8
40%
36%
-3%
Autauga
Alabama
58233
54632
1
1.8
74%
73%
-1%
Hardin
Texas
62616
54748
1
1.8
80%
86%
6%
Porter
Indiana
74064
164592
3
1.8
46%
50%
5%
Washington
Virginia
52387
54877
1
1.8
66%
75%
9%
Venango
Pennsylvania
53619
54925
1
1.8
59%
69%
10%
Ventura
California
91446
825706
15
1.8
43%
38%
-5%
Greene
Missouri
45313
275414
5
1.8
57%
60%
3%
Tuolumne
California
64729
55186
1
1.8
55%
57%
2%
Gordon
Georgia
53373
55214
1
1.8
74%
80%
6%
Clark
Indiana
59441
110610
2
1.8
53%
59%
6%
Carroll
Georgia
59193
110661
2
1.8
66%
68%
2%
Tom Green
Texas
54774
110679
2
1.8
70%
71%
1%
Macon
Illinois
52259
110715
2
1.8
49%
56%
7%
Bernalillo
New Mexico
56148
664639
12
1.8
39%
34%
-4%
Kenosha
Wisconsin
66460
166671
3
1.8
40%
47%
7%
Putnam
West Virginia
66991
55597
1
1.8
61%
71%
10%
Benton
Arkansas
70775
222894
4
1.8
67%
63%
-4%
La Porte
Indiana
56427
111465
2
1.8
38%
50%
12%
Terrebonne
Louisiana
51719
111861
2
1.8
69%
73%
3%
Hillsborough
Florida
61133
1233846
22
1.8
46%
45%
-1%
Cumberland
Tennessee
49142
56130
1
1.8
68%
77%
10%
Honolulu
Hawaii
86946
955775
17
1.8
29%
32%
3%
Edgecombe
North Carolina
40784
56539
1
1.8
33%
33%
1%
Johnston
North Carolina
62835
169735
3
1.8
61%
63%
2%
Mclean
Illinois
69230
169832
3
1.8
49%
47%
-2%
Seneca
Ohio
55664
56662
1
1.8
50%
62%
11%
Boone
Indiana
84137
56891
1
1.8
62%
61%
-1%
Faulkner
Arkansas
58482
113980
2
1.8
62%
62%
0%
Warren
Kentucky
53238
114172
2
1.8
59%
59%
0%
Lancaster
Nebraska
61383
286141
5
1.7
47%
45%
-1%
Stanislaus
California
62761
515358
9
1.7
48%
46%
-3%
Wilson
Tennessee
80080
114537
2
1.7
68%
69%
2%
Hillsborough
New Hampshire
82862
401057
7
1.7
47%
47%
-1%
Pike
Pennsylvania
66595
57329
1
1.7
52%
62%
10%
Du Page
Illinois
96354
918764
16
1.7
44%
39%
-5%
Lake
Ohio
65040
230101
4
1.7
49%
55%
7%
Washtenaw
Michigan
76728
345290
6
1.7
29%
27%
-2%
Hernando
Florida
50705
173008
3
1.7
51%
63%
12%
Duval
Florida
58339
865876
15
1.7
51%
49%
-2%
Prince William
Virginia
106208
406110
7
1.7
42%
36%
-5%
Vermilion
Louisiana
50193
58070
1
1.7
73%
78%
6%
Whiteside
Illinois
50880
58448
1
1.7
40%
49%
9%
Anderson
Texas
48461
58452
1
1.7
71%
78%
6%
Skagit
Washington
67551
117102
2
1.7
44%
44%
0%
Oneida
New York
56516
234845
4
1.7
52%
57%
4%
Duplin
North Carolina
44929
58728
1
1.7
54%
59%
4%
Benton
Washington
72847
176455
3
1.7
62%
59%
-3%
Cumberland
Pennsylvania
75269
235861
4
1.7
56%
57%
1%
Outagamie
Wisconsin
66994
176912
3
1.7
43%
53%
10%
Mobile
Alabama
49492
413277
7
1.7
54%
55%
1%
Barry
Michigan
67703
59044
1
1.7
54%
63%
10%
Solano
California
85704
414305
7
1.7
35%
31%
-4%
Windham
Connecticut
63309
118519
2
1.7
38%
51%
13%
Snohomish
Washington
89119
715470
12
1.7
40%
37%
-2%
Morgan
Alabama
54355
119626
2
1.7
71%
74%
3%
Hidalgo
Texas
41656
780087
13
1.7
30%
28%
-2%
Georgetown
South Carolina
53747
60094
1
1.7
52%
55%
3%
Oakland
Michigan
81257
1203012
20
1.7
42%
44%
1%
Livingston
Michigan
87827
180972
3
1.7
56%
62%
6%
Tulsa
Oklahoma
57668
605418
10
1.7
62%
58%
-4%
Grayson
Texas
57439
121145
2
1.7
68%
75%
6%
Jackson
Georgia
66645
60706
1
1.6
77%
80%
3%
Westmoreland
Pennsylvania
59407
365012
6
1.6
58%
64%
6%
Yakima
Washington
55674
244485
4
1.6
54%
54%
-1%
Spotsylvania
Virginia
90262
122853
2
1.6
53%
55%
2%
Jefferson
Louisiana
55909
432449
7
1.6
62%
55%
-7%
Hawaii
Hawaii
64929
185406
3
1.6
22%
27%
5%
Alachua
Florida
49880
247497
4
1.6
39%
36%
-2%
Plymouth
Massachusetts
90584
495780
8
1.6
45%
43%
-2%
Sauk
Wisconsin
63752
62025
1
1.6
38%
47%
9%
Ward
North Dakota
68634
62093
1
1.6
59%
68%
9%
Peoria
Illinois
57717
186311
3
1.6
42%
45%
3%
Mercer
West Virginia
41794
62282
1
1.6
63%
76%
13%
Lawrence
Ohio
46433
62380
1
1.6
57%
70%
14%
Anderson
South Carolina
54496
187269
3
1.6
66%
70%
4%
Sedgwick
Kansas
60014
499393
8
1.6
55%
55%
0%
Bucks
Pennsylvania
93587
625472
10
1.6
45%
48%
3%
Bradford
Pennsylvania
51356
62651
1
1.6
58%
71%
12%
Liberty
Georgia
51410
62819
1
1.6
36%
38%
2%
Riverside
California
72905
2203332
35
1.6
48%
44%
-4%
Sebastian
Arkansas
48945
125920
2
1.6
66%
65%
-1%
Columbia
New York
71563
63073
1
1.6
42%
45%
2%
Pulaski
Kentucky
43568
63135
1
1.6
77%
82%
5%
Canyon
Idaho
58670
189428
3
1.6
67%
65%
-2%
Thurston
Washington
77890
253087
4
1.6
38%
38%
-1%
Chesterfield
Virginia
81641
317102
5
1.6
53%
48%
-5%
Washington
Rhode Island
86450
127008
2
1.6
39%
41%
2%
Catoosa
Georgia
60753
63975
1
1.6
74%
78%
4%
Spalding
Georgia
49237
64081
1
1.6
59%
61%
2%
Merced
California
59733
256778
4
1.6
45%
41%
-4%
Otero
New Mexico
43135
64284
1
1.6
59%
59%
0%
Richland
South Carolina
52905
385745
6
1.6
35%
31%
-4%
San Patricio
Texas
57302
64586
1
1.5
58%
60%
2%
Manatee
Florida
64151
323435
5
1.5
53%
57%
4%
Lake
California
46897
64771
1
1.5
39%
43%
4%
Douglas
Nebraska
67264
518777
8
1.5
47%
45%
-2%
Waukesha
Wisconsin
91070
389964
6
1.5
62%
60%
-3%
Yuma
Arizona
47024
196509
3
1.5
56%
47%
-9%
Mccracken
Kentucky
48219
65539
1
1.5
62%
66%
4%
Black Hawk
Iowa
60010
131221
2
1.5
38%
43%
5%
Harrison
Texas
55171
65766
1
1.5
65%
71%
5%
Lexington
South Carolina
62059
263406
4
1.5
68%
66%
-3%
Clermont
Ohio
68724
197604
3
1.5
66%
68%
3%
San Bernardino
California
67398
2042441
31
1.5
46%
41%
-4%
Butler
Kansas
66199
65923
1
1.5
65%
69%
4%
Pierce
Washington
78779
795628
12
1.5
43%
42%
-1%
Walker
Alabama
45991
66947
1
1.5
72%
82%
10%
Grand Forks
North Dakota
57388
66991
1
1.5
47%
54%
7%
Yolo
California
70951
201190
3
1.5
31%
25%
-6%
Marquette
Michigan
54913
67131
1
1.5
39%
44%
6%
Robeson
North Carolina
36366
134473
2
1.5
43%
51%
8%
Norfolk
Massachusetts
106851
672376
10
1.5
40%
33%
-7%
Columbia
Pennsylvania
54377
67268
1
1.5
52%
64%
12%
Madison
Illinois
66591
269271
4
1.5
45%
54%
10%
Humboldt
California
51134
134794
2
1.5
34%
31%
-3%
Anne Arundel
Maryland
100916
539198
8
1.5
50%
45%
-5%
Monroe
New York
62159
744389
11
1.5
41%
39%
-1%
Allegheny
Pennsylvania
64799
1223583
18
1.5
42%
40%
-2%
Calhoun
Michigan
50205
136072
2
1.5
44%
53%
9%
Walker
Texas
47519
68185
1
1.5
61%
65%
4%
New London
Connecticut
75226
274055
4
1.5
39%
44%
5%
Greene
Tennessee
44975
68797
1
1.5
70%
79%
9%
Morgan
Indiana
63414
69061
1
1.4
63%
76%
13%
Clark
Ohio
50832
138193
2
1.4
50%
57%
7%
Rowan
North Carolina
52051
138446
2
1.4
61%
67%
6%
Sonoma
California
87084
485120
7
1.4
24%
22%
-2%
Jackson
Mississippi
53414
139698
2
1.4
67%
68%
1%
Dane
Wisconsin
77828
489309
7
1.4
26%
23%
-3%
Erie
Pennsylvania
51923
280686
4
1.4
39%
49%
9%
Kern
California
53245
842207
12
1.4
58%
53%
-5%
Belmont
Ohio
50166
70319
1
1.4
48%
68%
20%
Yavapai
Arizona
54242
211061
3
1.4
61%
62%
1%
Linn
Iowa
64783
211501
3
1.4
38%
41%
3%
Shiawassee
Michigan
55633
70606
1
1.4
45%
56%
12%
Harris
Texas
61638
4110771
58
1.4
49%
42%
-7%
Cuyahoga
Ohio
52503
1278208
18
1.4
30%
31%
0%
Riley
Kansas
51996
71481
1
1.4
53%
47%
-6%
Clallam
Washington
57571
71515
1
1.4
47%
48%
0%
Orange
Florida
63133
1149500
16
1.4
40%
36%
-5%
Niagara
New York
56371
216546
3
1.4
49%
56%
8%
Knox
Tennessee
60316
433108
6
1.4
61%
59%
-2%
Fairfax
Virginia
127898
1086743
15
1.4
39%
29%
-10%
York
Pennsylvania
69101
435490
6
1.4
56%
62%
6%
Montgomery
Pennsylvania
92340
801052
11
1.4
39%
37%
-2%
Iberia
Louisiana
47731
73236
1
1.4
61%
64%
4%
Wagoner
Oklahoma
65191
73349
1
1.4
71%
73%
3%
Nassau
Florida
72818
73473
1
1.4
72%
74%
2%
East Baton Rouge
Louisiana
56303
440909
6
1.4
48%
43%
-5%
Gwinnett
Georgia
72225
808719
11
1.4
55%
45%
-10%
Charles
Maryland
102510
147086
2
1.4
37%
33%
-4%
Augusta
Virginia
63621
73668
1
1.4
69%
72%
3%
Rock Island
Illinois
57772
147517
2
1.4
37%
42%
5%
Winnebago
Illinois
59510
295127
4
1.4
43%
47%
4%
Fort Bend
Texas
101361
590350
8
1.4
51%
45%
-6%
Tulare
California
56776
443688
6
1.4
57%
52%
-5%
Schuylkill
Pennsylvania
55951
148228
2
1.3
54%
70%
16%
Yellowstone
Montana
61435
148432
2
1.3
52%
59%
7%
Oconee
South Carolina
52240
74359
1
1.3
68%
72%
4%
Bullitt
Kentucky
66335
74473
1
1.3
65%
73%
7%
Lake
Florida
57660
297950
4
1.3
56%
60%
4%
Hancock
Ohio
62720
74727
1
1.3
61%
67%
7%
Wood
Wisconsin
57325
74793
1
1.3
42%
57%
14%
Burlington
New Jersey
88443
449149
6
1.3
40%
41%
0%
Franklin
Pennsylvania
62699
149834
2
1.3
66%
71%
6%
Forrest
Mississippi
40224
75113
1
1.3
56%
55%
-1%
Lorain
Ohio
59201
301449
4
1.3
40%
48%
7%
Clinton
Michigan
72666
75426
1
1.3
49%
53%
4%
Greenville
South Carolina
64399
452859
6
1.3
61%
59%
-2%
Lewis
Washington
58525
75487
1
1.3
58%
64%
6%
Johnson
Texas
66538
151211
2
1.3
73%
77%
4%
Albany
New York
69408
303833
4
1.3
34%
34%
0%
Rockingham
Virginia
67242
76413
1
1.3
67%
69%
2%
Lancaster
South Carolina
63842
76889
1
1.3
57%
61%
4%
Hampden
Massachusetts
59918
463678
6
1.3
36%
39%
3%
White
Arkansas
46388
77350
1
1.3
72%
77%
5%
Jefferson
Arkansas
40555
77358
1
1.3
36%
36%
0%
Summit
Ohio
57753
541565
7
1.3
41%
43%
2%
Kosciusko
Indiana
64677
77368
1
1.3
68%
75%
7%
Payne
Oklahoma
43025
77448
1
1.3
63%
60%
-4%
Lee
Florida
62364
620151
8
1.3
55%
59%
4%
Ross
Ohio
54728
78090
1
1.3
53%
61%
9%
Maricopa
Arizona
68634
3827371
49
1.3
55%
48%
-7%
Chittenden
Vermont
76483
156705
2
1.3
27%
22%
-4%
Cumberland
New Jersey
54179
157149
2
1.3
39%
45%
6%
Henderson
Texas
49896
78647
1
1.3
72%
79%
7%
Mclennan
Texas
51078
236028
3
1.3
62%
61%
-1%
Scioto
Ohio
45410
79506
1
1.3
52%
67%
15%
Salt Lake
Utah
79941
1033910
13
1.3
49%
33%
-16%
Elmore
Alabama
62310
79549
1
1.3
75%
74%
-1%
Buncombe
North Carolina
55448
238832
3
1.3
42%
40%
-2%
Sarpy
Nebraska
84016
159709
2
1.3
57%
56%
-1%
Kenton
Kentucky
68692
159876
2
1.3
60%
60%
0%
Cayuga
New York
58055
79978
1
1.3
45%
52%
8%
Luzerne
Pennsylvania
53439
320795
4
1.2
45%
58%
13%
Cattaraugus
New York
50783
80229
1
1.2
55%
63%
9%
Aiken
South Carolina
56824
160565
2
1.2
61%
61%
0%
Sumner
Tennessee
69391
161250
2
1.2
67%
70%
3%
Clark
Nevada
62131
1954260
24
1.2
39%
42%
2%
Cascade
Montana
51732
81519
1
1.2
48%
57%
9%
Vermilion
Illinois
46295
81551
1
1.2
49%
62%
14%
Los Angeles
California
72721
9830420
120
1.2
29%
22%
-6%
Jefferson
Alabama
54127
658555
8
1.2
47%
44%
-3%
Josephine
Oregon
47533
82807
1
1.2
55%
60%
6%
Marion
Florida
49079
331290
4
1.2
55%
62%
6%
Suffolk
New York
105241
1494434
18
1.2
47%
51%
5%
Lee
Mississippi
50803
83048
1
1.2
65%
68%
2%
Kent
Rhode Island
74230
166103
2
1.2
40%
47%
7%
Madison
Kentucky
50316
83157
1
1.2
61%
63%
2%
Limestone
Alabama
64729
83193
1
1.2
70%
72%
2%
Passaic
New Jersey
76039
501860
6
1.2
39%
37%
-2%
Hamilton
Tennessee
57802
337294
4
1.2
55%
55%
0%
Fresno
California
56926
933248
11
1.2
48%
44%
-4%
Nueces
Texas
56079
340480
4
1.2
52%
49%
-3%
District Of Columbia
District of Columbia
90395
604453
7
1.2
7%
4%
-2%
Ozaukee
Wisconsin
90446
86365
1
1.2
60%
56%
-4%
Polk
Iowa
67331
432260
5
1.2
42%
40%
-1%
Grand Traverse
Michigan
65041
87043
1
1.1
51%
53%
2%
Placer
California
97688
350048
4
1.1
55%
52%
-3%
Charleston
South Carolina
70980
351482
4
1.1
45%
43%
-2%
Lapeer
Michigan
66415
88210
1
1.1
50%
66%
16%
Sherburne
Minnesota
95323
88691
1
1.1
58%
64%
6%
Orange
California
95761
3018963
34
1.1
50%
42%
-8%
Hamilton
Ohio
60251
802252
9
1.1
46%
42%
-4%
Shawnee
Kansas
59451
178301
2
1.1
49%
48%
-2%
Montgomery
Ohio
54704
535059
6
1.1
46%
48%
2%
Queens
New York
72975
2233841
25
1.1
24%
22%
-3%
Dauphin
Pennsylvania
60763
268220
3
1.1
45%
47%
2%
Platte
Missouri
84456
89677
1
1.1
53%
53%
0%
New Castle
Delaware
76076
538986
6
1.1
29%
33%
3%
San Luis Obispo
California
76599
270113
3
1.1
46%
42%
-4%
Horry
South Carolina
53648
270430
3
1.1
62%
67%
6%
Okaloosa
Florida
63520
180728
2
1.1
72%
71%
-1%
Suffolk
Massachusetts
75843
723323
8
1.1
21%
16%
-5%
Atlantic
New Jersey
62678
274685
3
1.1
42%
45%
3%
Baldwin
Alabama
59871
183195
2
1.1
75%
77%
1%
Williamson
Tennessee
119637
184035
2
1.1
69%
64%
-5%
Butler
Pennsylvania
72576
184059
2
1.1
63%
66%
3%
Hamilton
Indiana
107710
276390
3
1.1
61%
57%
-4%
Fulton
Georgia
79235
926197
10
1.1
32%
27%
-5%
Jefferson
Kentucky
59025
742172
8
1.1
44%
41%
-3%
Marshall
Alabama
48913
93235
1
1.1
78%
83%
5%
Pottawattamie
Iowa
60322
93359
1
1.1
50%
57%
7%
Geauga
Ohio
79865
93408
1
1.1
57%
61%
4%
Ingham
Michigan
54704
280812
3
1.1
33%
33%
1%
Wayne
New York
61989
93753
1
1.1
54%
59%
5%
Dubuque
Iowa
62481
93880
1
1.1
39%
47%
8%
Sumter
Florida
63464
94074
1
1.1
63%
69%
6%
Clackamas
Oregon
80539
376891
4
1.1
44%
41%
-2%
Montgomery
Virginia
58740
94531
1
1.1
47%
45%
-2%
Dougherty
Georgia
36894
94577
1
1.1
32%
30%
-2%
Sutter
California
60910
94806
1
1.1
57%
54%
-3%
Litchfield
Connecticut
81015
189840
2
1.1
47%
54%
8%
Philadelphia
Pennsylvania
47598
1528306
16
1.0
16%
15%
-1%
Contra Costa
California
106555
1052827
11
1.0
30%
25%
-5%
New Haven
Connecticut
69687
862989
9
1.0
38%
42%
4%
Nash
North Carolina
50902
95938
1
1.0
50%
49%
-1%
Garland
Arkansas
45786
96145
1
1.0
61%
64%
3%
Floyd
Georgia
50520
96274
1
1.0
68%
70%
2%
Cabell
West Virginia
42125
96378
1
1.0
54%
60%
6%
Jackson
Missouri
57907
675259
7
1.0
50%
53%
3%
Brazos
Texas
54471
195693
2
1.0
64%
58%
-6%
Cleveland
North Carolina
46012
98050
1
1.0
59%
64%
4%
Rockingham
New Hampshire
91416
295360
3
1.0
49%
50%
1%
York
Maine
66803
197216
2
1.0
39%
44%
5%
Highlands
Florida
45723
98700
1
1.0
59%
65%
6%
Nevada
California
69550
98794
1
1.0
46%
43%
-4%
Volusia
Florida
53554
494527
5
1.0
47%
55%
8%
Sangamon
Illinois
61768
197822
2
1.0
47%
51%
4%
Lake
Indiana
57280
495981
5
1.0
32%
38%
5%
Northampton
Pennsylvania
73780
298101
3
1.0
43%
50%
7%
Yamhill
Oregon
71815
99391
1
1.0
49%
48%
-1%
Dakota
Minnesota
89075
399100
4
1.0
46%
43%
-3%
Newton
Georgia
58222
100086
1
1.0
49%
48%
-2%
Marion
Indiana
50707
904878
9
1.0
35%
36%
1%
Tarrant
Texas
70130
1817658
18
1.0
55%
52%
-4%
Cecil
Maryland
75307
101199
1
1.0
56%
64%
8%
Pennington
South Dakota
58919
101348
1
1.0
60%
62%
2%
Ashtabula
Ohio
47388
101429
1
1.0
42%
57%
15%
Sacramento
California
71891
1421959
14
1.0
39%
34%
-6%
New Hanover
North Carolina
57252
203341
2
1.0
50%
49%
-1%
Jackson
Oregon
56367
203462
2
1.0
49%
49%
1%
Houston
Alabama
50138
101888
1
1.0
70%
72%
2%
Cameron
Texas
40893
408054
4
1.0
35%
32%
-3%
Woodbury
Iowa
58419
102407
1
1.0
50%
57%
7%
Henry
Georgia
72927
205265
2
1.0
53%
46%
-7%
Oklahoma
Oklahoma
56272
721178
7
1.0
58%
52%
-7%
Mchenry
Illinois
89379
309192
3
1.0
47%
51%
4%
Kaufman
Texas
75009
103927
1
1.0
68%
72%
4%
Etowah
Alabama
43047
104462
1
1.0
68%
73%
5%
Bonneville
Idaho
65165
104592
1
1.0
70%
60%
-10%
Davidson
Tennessee
63846
628133
6
1.0
39%
34%
-5%
Marion
Oregon
64058
316096
3
0.9
47%
46%
-1%
Seminole
Florida
69954
423508
4
0.9
51%
49%
-2%
Santa Barbara
California
74530
424712
4
0.9
37%
32%
-6%
Warren
Ohio
91645
213192
2
0.9
67%
66%
-1%
Williamson
Texas
92661
426645
4
0.9
56%
51%
-4%
Fayette
Georgia
94563
106945
1
0.9
65%
58%
-7%
Henderson
North Carolina
61651
106978
1
0.9
60%
62%
2%
Collier
Florida
76415
322472
3
0.9
61%
62%
1%
Saline
Arkansas
66944
107532
1
0.9
69%
69%
-1%
Middlesex
Massachusetts
106543
1506008
14
0.9
34%
28%
-6%
Columbiana
Ohio
52693
107800
1
0.9
53%
69%
16%
Eaton
Michigan
65891
107838
1
0.9
45%
49%
4%
Ascension
Louisiana
83072
107891
1
0.9
67%
66%
-1%
Vigo
Indiana
48082
107958
1
0.9
41%
55%
14%
Barnstable
Massachusetts
82686
215937
2
0.9
42%
40%
-2%
Ontario
New York
66754
108116
1
0.9
49%
50%
0%
Montgomery
Maryland
110012
976203
9
0.9
27%
19%
-8%
Warren
New Jersey
83998
108714
1
0.9
57%
61%
4%
Brevard
Florida
57582
543573
5
0.9
55%
58%
3%
Comal
Texas
87976
109382
1
0.9
73%
73%
-1%
Broward
Florida
61429
1753578
16
0.9
32%
31%
-1%
Butte
California
58394
220072
2
0.9
48%
47%
0%
Anoka
Minnesota
83363
331302
3
0.9
50%
50%
0%
Clay
Missouri
70705
222718
2
0.9
50%
52%
2%
Essex
New Jersey
64522
784228
7
0.9
24%
20%
-3%
Wake
North Carolina
84377
906969
8
0.9
42%
37%
-5%
Cache
Utah
63180
113417
1
0.9
70%
46%
-25%
York
South Carolina
68468
226971
2
0.9
58%
58%
0%
La Salle
Illinois
59528
113840
1
0.9
44%
54%
10%
Worcester
Massachusetts
77795
799553
7
0.9
42%
41%
-1%
La Crosse
Wisconsin
59758
114874
1
0.9
37%
42%
4%
Arapahoe
Colorado
82364
575022
5
0.9
43%
39%
-4%
Cobb
Georgia
79622
690063
6
0.9
54%
46%
-8%
Sheboygan
Wisconsin
62108
115472
1
0.9
50%
54%
5%
Shelby
Tennessee
52659
929030
8
0.9
36%
34%
-1%
Frederick
Maryland
102951
234122
2
0.9
50%
47%
-2%
Jasper
Missouri
46021
117770
1
0.8
66%
73%
7%
Dallas
Texas
61807
2377351
20
0.8
42%
35%
-7%
Pickens
South Carolina
52949
119217
1
0.8
72%
74%
2%
Boone
Kentucky
78806
119290
1
0.8
67%
68%
1%
King
Washington
102338
1937961
16
0.8
28%
22%
-7%
Gregg
Texas
53137
121854
1
0.8
69%
69%
0%
Oswego
New York
57640
122114
1
0.8
48%
57%
10%
Kennebec
Maine
55358
122143
1
0.8
42%
48%
6%
Mercer
New Jersey
79475
366789
3
0.8
32%
30%
-2%
Blount
Tennessee
59368
123119
1
0.8
69%
72%
3%
Morris
New Jersey
116328
492694
4
0.8
54%
50%
-4%
Strafford
New Hampshire
71486
123198
1
0.8
39%
42%
3%
Washington
Tennessee
51879
123338
1
0.8
66%
69%
3%
Cook
Illinois
69375
5200950
42
0.8
23%
21%
-2%
Brown
Wisconsin
65494
248506
2
0.8
45%
52%
7%
Columbia
Georgia
88285
124815
1
0.8
71%
67%
-4%
Wright
Minnesota
91374
125118
1
0.8
58%
62%
5%
Kalamazoo
Michigan
56739
250738
2
0.8
39%
40%
1%
Bronx
New York
41470
1386657
11
0.8
11%
9%
-1%
Jefferson
Texas
55173
252390
2
0.8
49%
49%
0%
Marin
California
112069
252916
2
0.8
20%
16%
-5%
Sarasota
Florida
66258
379874
3
0.8
50%
54%
5%
Weld
Colorado
78160
254270
2
0.8
53%
57%
3%
Coweta
Georgia
79232
127955
1
0.8
70%
69%
-1%
Livingston
Louisiana
63852
128549
1
0.8
85%
85%
0%
Kane
Illinois
84311
516499
4
0.8
43%
42%
-2%
Franklin
Ohio
64648
1165897
9
0.8
39%
34%
-5%
Clayton
Georgia
50737
259623
2
0.8
17%
14%
-3%
Utah
Utah
79505
520049
4
0.8
78%
51%
-27%
Scott
Minnesota
108718
130487
1
0.8
55%
53%
-1%
Johnson
Iowa
67295
131225
1
0.8
28%
27%
-1%
Rapides
Louisiana
49687
131779
1
0.8
64%
65%
1%
Mecklenburg
North Carolina
69455
923427
7
0.8
37%
33%
-5%
Douglas
Georgia
62915
132722
1
0.8
49%
43%
-6%
Marathon
Wisconsin
66092
134104
1
0.7
45%
56%
11%
Nassau
New York
117767
1341245
10
0.7
45%
45%
0%
Durham
North Carolina
65541
268454
2
0.7
24%
18%
-5%
Baltimore
Maryland
76972
805709
6
0.7
42%
38%
-3%
Milwaukee
Wisconsin
53505
948944
7
0.7
31%
29%
-3%
Johnson
Kansas
91913
545876
4
0.7
54%
47%
-6%
Florence
South Carolina
49770
137088
1
0.7
51%
51%
0%
Kootenai
Idaho
62764
138901
1
0.7
62%
67%
5%
Houston
Georgia
65641
140713
1
0.7
60%
59%
-1%
Lee
Alabama
54160
140780
1
0.7
59%
58%
-1%
Rankin
Mississippi
67284
142018
1
0.7
77%
75%
-1%
Paulding
Georgia
76580
142741
1
0.7
69%
69%
0%
Gloucester
New Jersey
87996
288581
2
0.7
44%
48%
5%
Hennepin
Minnesota
82323
1154623
8
0.7
35%
28%
-7%
Olmsted
Minnesota
80631
144509
1
0.7
47%
45%
-3%
Santa Fe
New Mexico
61791
144606
1
0.7
22%
20%
-2%
Fairfield
Ohio
71782
146351
1
0.7
58%
61%
3%
Washington
Maryland
59785
147558
1
0.7
55%
62%
7%
Dutchess
New York
84564
297577
2
0.7
45%
47%
2%
Hartford
Connecticut
75336
894478
6
0.7
34%
36%
3%
Sussex
New Jersey
100281
149239
1
0.7
60%
63%
3%
Stearns
Minnesota
66449
150785
1
0.7
52%
60%
8%
Bergen
New Jersey
107971
906541
6
0.7
45%
42%
-3%
Alamance
North Carolina
57963
151528
1
0.7
54%
55%
0%
Santa Rosa
Florida
66139
151966
1
0.7
73%
74%
1%
Tolland
Connecticut
90181
152781
1
0.7
39%
44%
5%
Fairfield
Connecticut
96966
918714
6
0.7
41%
38%
-3%
Schenectady
New York
64960
154889
1
0.6
43%
43%
0%
Maui
Hawaii
77375
155124
1
0.6
22%
26%
4%
Pasco
Florida
55745
465543
3
0.6
51%
59%
8%
Sullivan
Tennessee
51303
156794
1
0.6
70%
75%
5%
Berrien
Michigan
50659
156805
1
0.6
47%
54%
7%
Monmouth
New Jersey
102579
630966
4
0.6
52%
53%
1%
Wyandotte
Kansas
47292
157845
1
0.6
29%
32%
4%
Westchester
New York
101741
950541
6
0.6
36%
31%
-5%
New York
New York
93007
1586698
10
0.6
13%
10%
-4%
Iredell
North Carolina
68308
159771
1
0.6
62%
66%
5%
Charlotte
Florida
54756
159990
1
0.6
53%
62%
9%
Rock
Wisconsin
61624
160310
1
0.6
35%
41%
7%
Santa Clara
California
132444
1787694
11
0.6
29%
21%
-8%
Davidson
North Carolina
53924
162930
1
0.6
66%
73%
6%
Beaufort
South Carolina
73890
162989
1
0.6
55%
55%
0%
Middlesex
Connecticut
81721
165697
1
0.6
38%
44%
6%
Denton
Texas
90910
667053
4
0.6
62%
57%
-5%
Carroll
Maryland
101810
167241
1
0.6
64%
63%
-1%
Macomb
Michigan
65051
841126
5
0.6
45%
54%
9%
Ramsey
Minnesota
68652
509320
3
0.6
32%
26%
-6%
Monroe
Pennsylvania
63012
169896
1
0.6
41%
48%
6%
Medina
Ohio
78540
172592
1
0.6
53%
60%
7%
Lehigh
Pennsylvania
65436
350106
2
0.6
42%
46%
4%
Lane
Oregon
57212
351983
2
0.6
35%
35%
0%
Allen
Indiana
56838
355856
2
0.6
52%
57%
5%
Cabarrus
North Carolina
72071
178588
1
0.6
59%
58%
-1%
Berkeley
South Carolina
68690
178783
1
0.6
56%
56%
0%
Union
New Jersey
79953
537661
3
0.6
36%
31%
-5%
Onslow
North Carolina
50645
179471
1
0.6
60%
65%
5%
Wayne
Michigan
50753
1815734
10
0.6
25%
29%
5%
Pinellas
Florida
56708
916719
5
0.5
45%
49%
3%
Delaware
Pennsylvania
76783
559276
3
0.5
39%
37%
-2%
Orange
New York
83188
373355
2
0.5
47%
50%
3%
Palm Beach
Florida
66621
1323394
7
0.5
38%
41%
3%
Alameda
California
107589
1513952
8
0.5
19%
15%
-5%
Ocean
New Jersey
75627
577603
3
0.5
59%
65%
6%
Tuscaloosa
Alabama
52307
195036
1
0.5
58%
58%
0%
Shelby
Alabama
77801
195828
1
0.5
76%
72%
-4%
Collin
Texas
96847
788407
4
0.5
62%
56%
-7%
Polk
Florida
51817
602788
3
0.5
53%
55%
3%
Whatcom
Washington
68656
201628
1
0.5
40%
37%
-3%
Middlesex
New Jersey
92770
810986
4
0.5
39%
38%
-1%
Washington
Arkansas
52158
204123
1
0.5
56%
51%
-5%
Gaston
North Carolina
56542
206213
1
0.5
62%
64%
2%
Monterey
California
76509
416682
2
0.5
30%
26%
-4%
Providence
Rhode Island
62165
627070
3
0.5
32%
37%
5%
Arlington
Virginia
118986
209457
1
0.5
27%
17%
-10%
Trumbull
Ohio
47966
209936
1
0.5
38%
51%
13%
Jefferson
Missouri
68779
219084
1
0.5
48%
65%
17%
Lucas
Ohio
49924
441468
2
0.5
34%
38%
5%
Weber
Utah
71835
232228
1
0.4
63%
47%
-15%
Richmond
New York
86624
469363
2
0.4
52%
56%
4%
Mahoning
Ohio
48018
238310
1
0.4
36%
47%
11%
Washington
Minnesota
100857
238844
1
0.4
47%
45%
-2%
Chester
Pennsylvania
102233
499797
2
0.4
45%
43%
-2%
Webb
Texas
52576
251632
1
0.4
28%
23%
-5%
Lancaster
Pennsylvania
67515
520156
2
0.4
55%
57%
2%
Rutherford
Tennessee
69614
263740
1
0.4
59%
60%
1%
Jefferson
Colorado
89696
535533
2
0.4
45%
42%
-3%
San Francisco
California
121795
805463
3
0.4
14%
9%
-4%
Douglas
Colorado
123697
287003
1
0.3
58%
55%
-3%
Howard
Maryland
121329
288376
1
0.3
38%
29%
-9%
Larimer
Colorado
75332
300637
1
0.3
44%
43%
-2%
Denver
Colorado
75456
604414
2
0.3
23%
19%
-4%
Henrico
Virginia
68975
307435
1
0.3
43%
37%
-7%
Rockland
New York
99831
312183
1
0.3
47%
45%
-2%
Hudson
New Jersey
77738
635294
2
0.3
26%
22%
-4%
Somerset
New Jersey
112722
324194
1
0.3
47%
42%
-5%
Madison
Alabama
68609
335988
1
0.3
57%
55%
-2%
Travis
Texas
80690
1030806
3
0.3
34%
27%
-7%
Forsyth
North Carolina
53054
351335
1
0.3
44%
43%
-2%
San Mateo
California
135234
720162
2
0.3
25%
18%
-6%
Pinal
Arizona
62067
383842
1
0.3
57%
56%
0%
Berks
Pennsylvania
67418
411850
1
0.2
45%
53%
8%
Onondaga
New York
61597
467204
1
0.2
39%
40%
1%
Will
Illinois
90249
678697
1
0.1
43%
44%
1%
Trump failed to live up to his campaign rhetoric on foreign policy and the expectations of his ardent supporters. While he did end Operation Timber Sycamore, the U.S. government’s aid program to anti-Assad rebels in Syria, he failed to end the war in Afghanistan, flirted with regime change in Venezuela, and nearly started a war with Iran. However, the bar of U.S. foreign policy is so low that his supporters could honestly claim that he started no new wars.
With Trump out of the White House, these disparities continue to animate American populism. War and interventionism remain prevalent issues with the populist right because their motivations were not primarily tied to Trump, despite the assertions by many in the corporate press. Additionally, war and intervention remain a popular issue for the populist right because mainstream politicians and cultural figures ignore or dismiss them.
Conservatives, who are overrepresented among active military and veterans, are tired of being asked to sacrifice for an elite class that views them with disdain. An accelerating populist distrust for elites has only grown due to two years of COVID lockdown policies; policies are often sold on “noble lies.” This narrative is evident in the memes and discourse circulating on the right.
A sampling of the right-wing memes that depict a connection between the culture war, a disdain for establishment politics, domestic COVID policy, and their opposition to U.S. involvement in the Ukraine crisis. For an explainer on some of these meme characters, see here.
These issues are not going away. And attempts to turn U.S. involvement in the #UkraineWar into a cultural issue will only amplify them. Chiding conservatives over their concerns over inflation and rising gas prices furthers their sense of alienation. Furthermore, cynical attempts to leverage crisis-related gas shortages and inflation into radical and permanent economic policies will only breed further hostility. Large segments of the American middle and working classes never fully recovered from the 2008 financial crisis. In the past 14 years, they’ve seen the value of their savings and earnings decrease due to inflation. Asking them to make further sacrifices is a tall order, and dismissing their concerns as selfish isn’t going to motivate them either.
America’s martial caste is, by and large, choosing to abstain from this conflict and, at the least, remain among those most hesitant for further American involvement. If well-meaning people want to prevent this abstention from turning into rebellion, the first step is to recognize that these issues have a longer history than the news cycle and have roots deeper than the #UkraineCrisis. Furthermore, they are grounded in real hardships and legitimate political concerns and are not merely motivated by politics that liberals find distasteful.
Antiwar.com was gracious enough to publish an essay that I’ve been working on, “Bear Any Burden: Military Sacrifice and Rise of American Populism.”
It argues that the economic, geographic, and racial disparities in military sacrifice during the Global War on Terrorism is the prime cause for modern American populism and the erosion of institutional trust in the United States. If you’d like to read more, the link is below:
I know that we are living in highly polarized times, and for many, this may be a controversial thesis. I merely ask that it be approached with an open mind.
Also linked below is a repository for the datasets and code used to generate the plots and calculate some of the statistics.